Comparative Study
. 2012 Feb;10(1):24-36.
doi: 10.1089/adt.2011.423. Epub 2012 Jan 26.

Domain-based biosensor assay to screen for epidermal growth factor receptor modulators in live cells

Affiliations
Comparative Study

Domain-based biosensor assay to screen for epidermal growth factor receptor modulators in live cells

Christophe Antczak et al. Assay Drug Dev Technol. 2012 Feb.

Abstract

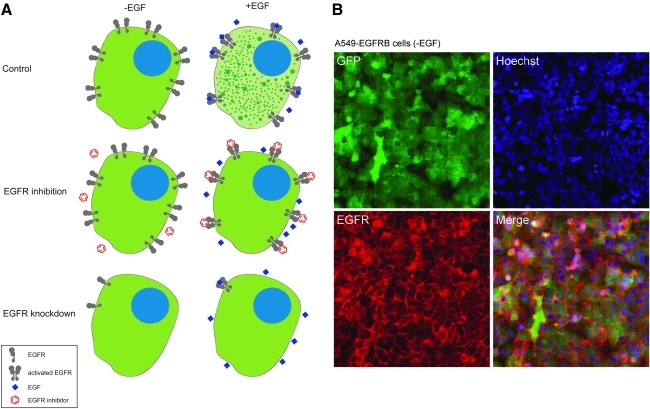
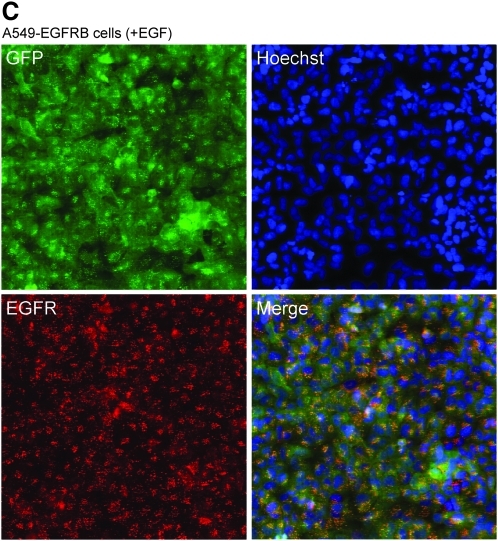
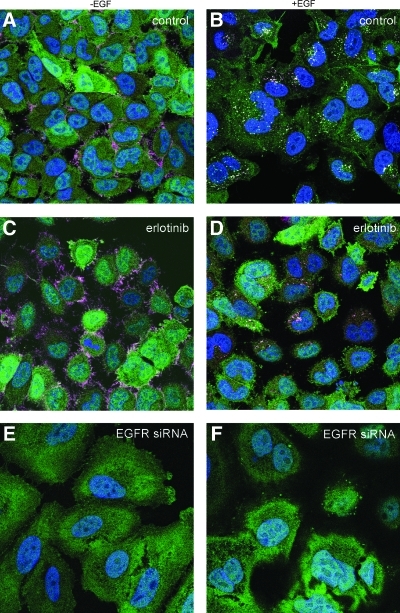
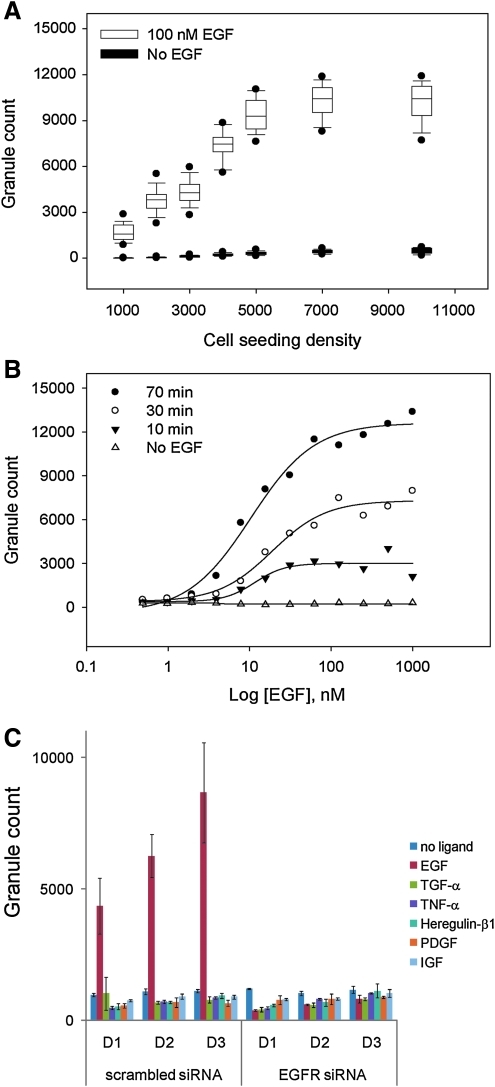
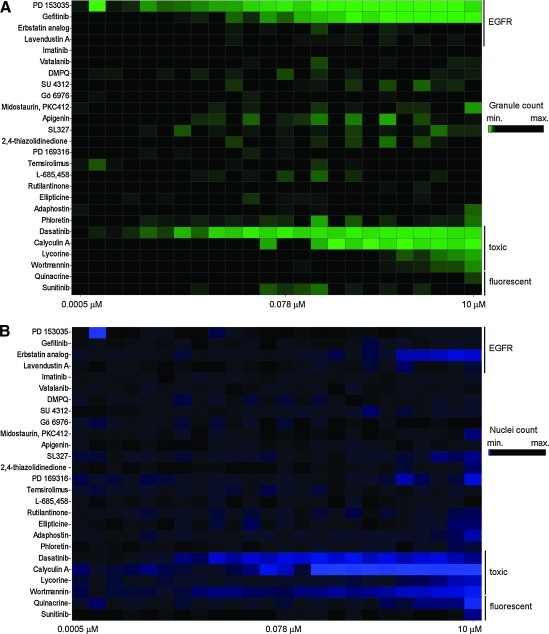
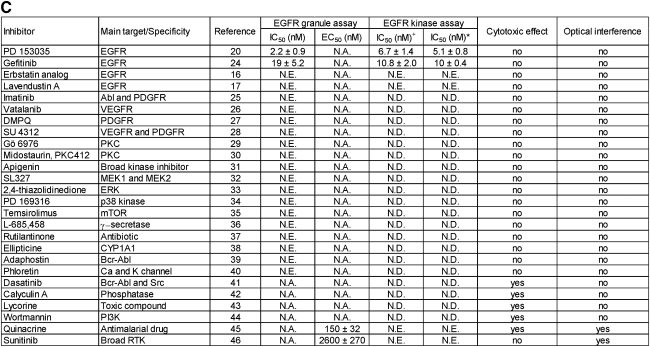
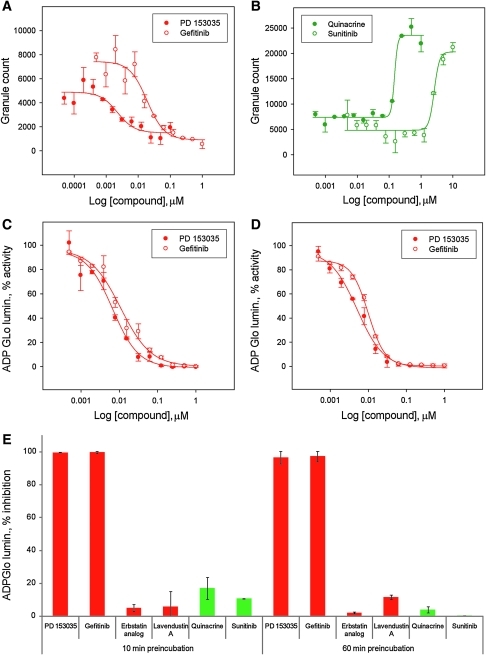
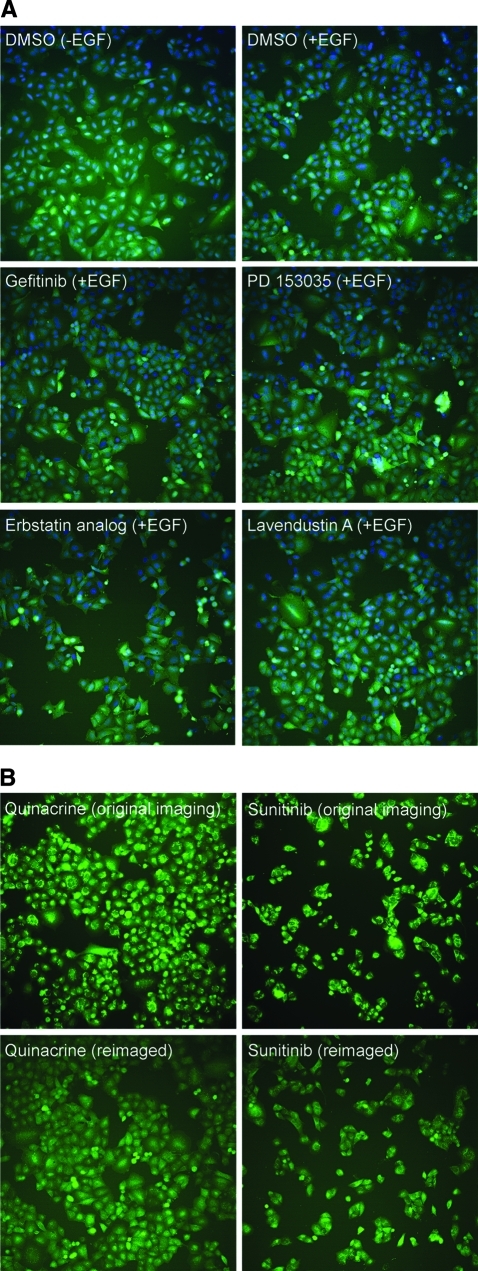
Traditional drug discovery efforts have resulted in the approval of a handful of receptor tyrosine kinase (RTK) inhibitors; however, their discovery relied solely on screening recombinant kinases, often with poor cellular activity outcome. The ability to screen RTKs in their natural environment is sought as an alternative approach. We have adapted a novel strategy utilizing a green fluorescent protein-labeled SRC homology 2 domain-based biosensor as a surrogate reporter of endogenous epidermal growth factor receptor (EGFR) activity in A549 cells. Upon activation of the receptor, EGFR function in live cells is measured by the number of green granules that form. Here we describe assay miniaturization and demonstrate specificity for EGFR through its chemical inhibition and RNAi-dependent knockdown resulting in complete abrogation of granule formation. Gefitinib and PD 153035 were identified as hits in a pilot screen. This approach allows for the identification of novel EGFR modulators in high-throughput formats for screening chemical and RNAi libraries.


Figures

Fig. 1.
Fig. 1.
Epidermal growth factor receptor (EGFR) biosensor assay principle. (A) Schematics demonstrating the principle of the EGFR biosensor assay with A549 EGFR biosensor (A549-EGFRB) cells in the absence and presence of EGF stimulation. Green fluorescent protein (GFP) expression is diffuse in the cytoplasm in the absence of epidermal growth factor (EGF) stimulation, and EGF addition leads to the recruitment and clustering of the EGFR biosensor, enabling live imaging and quantification of granule formation as a surrogate for measuring endogenous EGFR activity. EGFR biosensor activation by EGF is prevented by small molecule EGFR inhibitor and by EGFR knockdown using RNAi. (B, C) EGFR biosensor activation is induced by EGF and reports EGFR activation. A549-EGFRB cells imaged with the confocal microscope INCA3000 at 40× objective magnification in the absence (B) or presence (C) of EGF stimulation. Green channel: EGF biosensor (GFP); blue channel: Hoechst staining of nuclei; red channel: immunostaining of EGFR and overlay of three channels.
Fig. 1.
Fig. 1.
Epidermal growth factor receptor (EGFR) biosensor assay principle. (A) Schematics demonstrating the principle of the EGFR biosensor assay with A549 EGFR biosensor (A549-EGFRB) cells in the absence and presence of EGF stimulation. Green fluorescent protein (GFP) expression is diffuse in the cytoplasm in the absence of epidermal growth factor (EGF) stimulation, and EGF addition leads to the recruitment and clustering of the EGFR biosensor, enabling live imaging and quantification of granule formation as a surrogate for measuring endogenous EGFR activity. EGFR biosensor activation by EGF is prevented by small molecule EGFR inhibitor and by EGFR knockdown using RNAi. (B, C) EGFR biosensor activation is induced by EGF and reports EGFR activation. A549-EGFRB cells imaged with the confocal microscope INCA3000 at 40× objective magnification in the absence (B) or presence (C) of EGF stimulation. Green channel: EGF biosensor (GFP); blue channel: Hoechst staining of nuclei; red channel: immunostaining of EGFR and overlay of three channels.
Fig. 2.
Fig. 2.
EGFR granule forming activity is inhibited by small molecules and RNAi knockdown. High resolution confocal imaging microscopy was performed at 100× objective magnification of A549-EGFRB cells in the absence and presence of EGF stimulation. Images of A549-EGFRB cells treated with 1% DMSO (v/v) control, 10 μM erlotinib in 1% DMSO (v/v), or 1% DMSO (v/v) control previously transfected with EGFR silencing siRNA. Each image is the overlay of the blue channel: nuclei; green channel: EGFR biosensor (GFP); and red channel: EGFR immunostaining.
Fig. 3.
Fig. 3.
EGFR biosensor characterization and assay miniaturization. (A) Optimization of A549-EGFRB cell seeding density leading to the selection of 5000 cells per well for the assay in 384-well format. In this box plot summarizing all replicate data (n=48), the bottom and top of the box represent the 25th and 75th percentiles, crossed by the median line. The end of whiskers below and above the box indicate the 10th and 90th percentiles. The outlying points show the 5th and 95th percentiles. White boxes correspond to 100 nM EGF stimulation and black boxes correspond to no EGF stimulation control. (B) Dose response of GFP granule count as a function of EGF concentration and duration of EGF stimulation in 384-well format, leading to the selection of 500 nM EGF stimulation for 70 min as the optimal conditions for the assay. The tested durations of EGF stimulation were 10 (▾), 30 (○), and 70 min (•), along with no EGF stimulation control (▴). The data presented correspond to one representative experiment. (C) Bar graph of granule count following treatment with RTK ligands and cytokines at three concentrations (D1, D2, D3), following transfection with scrambled or EGFR siRNA in a 384-well format. The data presented are means±standard error of replicate wells (n=8). TGF-α, transforming growth factor-α; TNF-α, tumor necrosis factor α; PDGF, platelet-derived growth factor; IGF, insulin-like growth factor.
Fig. 4.
Fig. 4.
Pilot screen against a panel of 26 known effectors. (A) and (B) The results are presented as a heatmap to show the performance of the panel of 26 effectors that prevent granule formation (green) or are cytotoxic (blue) or inactive in the assay (black). Cytotoxic and fluorescent compounds are highlighted. (C) Summary table of the panel of 26 effectors tested in the EGFR biosensor assay summary of IC50 and EC50 data for dose–response curves fitted using logistic four parameter sigmoid regression. In the EGFR kinase assay, IC50 values were assessed following 10 min of pre-incubation of the compound with the enzyme (+) or 60 min (*). The standard error corresponds to the standard error of the regression. Cytotoxicity is assessed based on the nuclei count, and a compound was deemed cytotoxic if the imaged nuclei count was less than 50% of the DMSO control wells. 2,4-Thiazolidinedione is the abbreviated name for 3-(2-aminoethyl)-5-((4-ethoxyphenyl)methylene)-2,4-thiazolidinedione. NE, no effect; ND, not determined; NA, not applicable; PI3K, phosphatidylinositol-3-kinase; PDGFR, platelet-derived growth factor receptor; PKC, protein kinase C; VEGFR, vascular endothelial growth factor receptor.
Fig. 4.
Fig. 4.
Pilot screen against a panel of 26 known effectors. (A) and (B) The results are presented as a heatmap to show the performance of the panel of 26 effectors that prevent granule formation (green) or are cytotoxic (blue) or inactive in the assay (black). Cytotoxic and fluorescent compounds are highlighted. (C) Summary table of the panel of 26 effectors tested in the EGFR biosensor assay summary of IC50 and EC50 data for dose–response curves fitted using logistic four parameter sigmoid regression. In the EGFR kinase assay, IC50 values were assessed following 10 min of pre-incubation of the compound with the enzyme (+) or 60 min (*). The standard error corresponds to the standard error of the regression. Cytotoxicity is assessed based on the nuclei count, and a compound was deemed cytotoxic if the imaged nuclei count was less than 50% of the DMSO control wells. 2,4-Thiazolidinedione is the abbreviated name for 3-(2-aminoethyl)-5-((4-ethoxyphenyl)methylene)-2,4-thiazolidinedione. NE, no effect; ND, not determined; NA, not applicable; PI3K, phosphatidylinositol-3-kinase; PDGFR, platelet-derived growth factor receptor; PKC, protein kinase C; VEGFR, vascular endothelial growth factor receptor.
Fig. 5.
Fig. 5.
Performance of selected effectors in the EGFR granule assay and EGFR kinase assay. Dose response curves in the EGFR granule assay of the EGFR inhibitors PD 153035 (•) and gefitinib (○) (calculated IC50 values: PD 153035 2.2±0.9 nM, gefitinib 19±5.2 nM) (A) and of the identified fluorescent compounds quinacrine (•) and sunitinib (○) (calculated apparent EC50 values: quinacrine 150±32 nM, sunitinib 2600±270 nM) (B). Dose–response curves in the EGFR kinase assay of the EGFR inhibitors PD 153035 (•) and gefitinib (○) following 10-min pre-incubation of the compound with the enzyme (calculated IC50 values: PD 153035 6.7±1.4 nM, gefitinib 10.8±2.0 nM) (C) or 60 min (calculated IC50 values: PD 153035 5.1±0.8 nM, gefitinib 10±0.4 nM) (D). Dose–response curves were fitted using logistic four parameter sigmoid regressions to calculate IC50 and EC50 values. Data from one representative experiment is presented for dose response in the EGFR granule assay and each data point corresponds to the mean of duplicates for data from the EGFR kinase assay (n=2). The standard error corresponds to the standard error of the regression. (E) Performance in the EGFR kinase assay of the reported EGFR inhibitors PD 153035, gefitinib, erbstatin analog, and lavendustin A as well as the fluorescent compounds quinacrine and sunitinib at 10 μM in 1% DMSO (v/v), following 10 or 60 min of pre-incubation with the enzyme. The data presented are means±standard deviation of duplicate wells (n=2).
Fig. 6.
Fig. 6.
Images of A549-EGFRB cells treated with selected compounds (A) INCA2000 imaging at 20× objective magnification of A549-EGFRB cells treated with 1% DMSO (v/v) control in absence or presence of 500 nM EGF stimulation for 70 min, and after EGF stimulation following pretreatment in 1% DMSO (v/v) with 1 μM gefitinib, 1 μM PD 153035, 10 μM erbstatin analog, or 10 μM lavendustin A. Overlay of blue channel: Hoechst staining of nuclei; green channel: EGFR biosensor (GFP). (B) INCA2000 imaging in the green channel: EGFR biosensor (GFP) at 20× objective magnification of A549-EGFRB cells treated with 1 μM quinacrine and 10 μM sunitinib in 1% DMSO (v/v) after 500 nM EGF stimulation for 70 min. Original images are compared to images acquired several weeks after the original imaging. Re-imaged fields of view may not be identical to those originally imaged but are representative of the whole well.

Similar articles

Cited by

References

    1. Gschwind A. Fischer OM. Ullrich A. The discovery of receptor tyrosine kinases: targets for cancer therapy. Nat Rev Cancer. 2004;4:361–370. - PubMed
    1. Pao W. Chmielecki J. Rational, biologically based treatment of EGFR-mutant non-small-cell lung cancer. Nat Rev Cancer. 2010;10:760–774. - PMC - PubMed
    1. Hynes NE. Lane HA. ERBB receptors and cancer: the complexity of targeted inhibitors. Nat Rev Cancer. 2005;5:341–354. - PubMed
    1. Ciaccio MF. Wagner JP. Chuu CP. Lauffenburger DA. Jones RB. Systems analysis of EGF receptor signaling dynamics with microwestern arrays. Nat Methods. 2010;7:148–155. - PMC - PubMed
    1. Botvinnik A. Wichert SP. Fischer TM. Rossner MJ. Integrated analysis of receptor activation and downstream signaling with EXTassays. Nat Methods. 2010;7:74–80. - PubMed

Publication types

MeSH terms