

Perceptual interaction of the harmonic source and noise in voice
- PMID: 22280610
- PMCID: PMC3283904
- DOI: 10.1121/1.3665997
Perceptual interaction of the harmonic source and noise in voice
Abstract
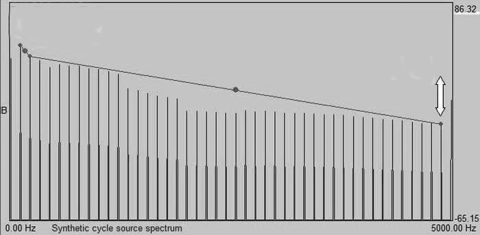
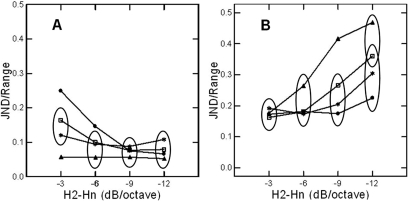
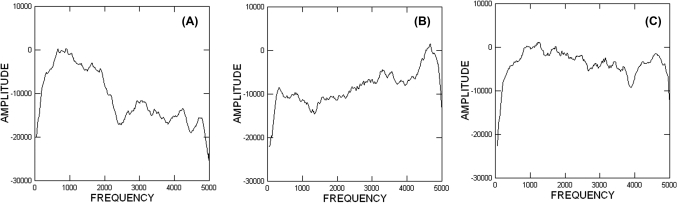
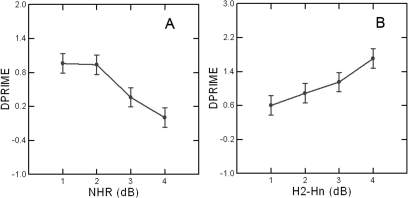
Although the amount of inharmonic energy (noise) present in a human voice is an important determinant of vocal quality, little is known about the perceptual interaction between harmonic and inharmonic aspects of the voice source. This paper reports three experiments investigating this issue. Results indicate that perception of the harmonic slope and of noise levels are both influenced by complex interactions between the spectral shape and relative levels of harmonic and noise energy in the voice source. Just-noticeable differences (JNDs) for the noise-to-harmonics ratio (NHR) varied significantly with the NHR and harmonic spectral slope, but NHR had no effect on JNDs for NHR when harmonic slopes were steepest, and harmonic slope had no effect when NHRs were highest. Perception of changes in the harmonic source slope depended on NHR and on the harmonic source slope: JNDs increased when spectra rolled off steeply, with this effect in turn depending on NHR. Finally, all effects were modulated by the shape of the noise spectrum. It thus appears that, beyond masking, understanding perception of individual parameters requires knowledge of the acoustic context in which they function, consistent with the view that voices are integral patterns that resist decomposition.
© 2012 Acoustical Society of America.
Figures
References
-
- Buder, E. H. (2000). “Acoustic analysis of voice quality: A tabulation of algorithms 1902–1990,” in Voice Quality Measurement, edited by Kent R. D. (Singular, San Diego, CA: ), pp. 119–244.
-
- de Krom, G. (1993). “A cepstrum-based technique for determining a harmonics-to-noise ratio in speech signals,” J. Speech Hear. Res. 36, 254–266. - PubMed
-
- de Krom, G. (1995). “Some spectral correlates of pathological breathy and rough voice quality for different types of vowel fragments,” J. Speech Hear. Res. 38, 794–811. - PubMed
Publication types
MeSH terms
Grants and funding
LinkOut - more resources
Full Text Sources
Medical