. 2012 Jan;131(1):518-30.
doi: 10.1121/1.3662074.

The relative phonetic contributions of a cochlear implant and residual acoustic hearing to bimodal speech perception

Affiliations

The relative phonetic contributions of a cochlear implant and residual acoustic hearing to bimodal speech perception

Benjamin M Sheffield et al. J Acoust Soc Am. 2012 Jan.

Abstract

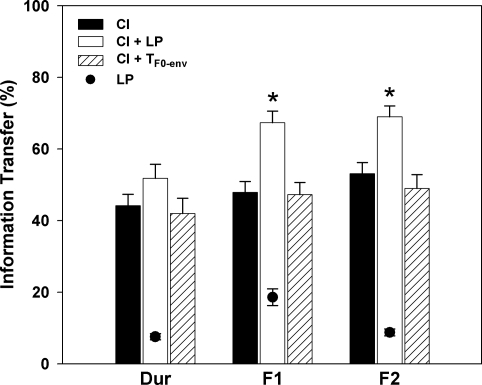
The addition of low-passed (LP) speech or even a tone following the fundamental frequency (F0) of speech has been shown to benefit speech recognition for cochlear implant (CI) users with residual acoustic hearing. The mechanisms underlying this benefit are still unclear. In this study, eight bimodal subjects (CI users with acoustic hearing in the non-implanted ear) and eight simulated bimodal subjects (using vocoded and LP speech) were tested on vowel and consonant recognition to determine the relative contributions of acoustic and phonetic cues, including F0, to the bimodal benefit. Several listening conditions were tested (CI/Vocoder, LP, T(F0-env), CI/Vocoder + LP, CI/Vocoder + T(F0-env)). Compared with CI/Vocoder performance, LP significantly enhanced both consonant and vowel perception, whereas a tone following the F0 contour of target speech and modulated with an amplitude envelope of the maximum frequency of the F0 contour (T(F0-env)) enhanced only consonant perception. Information transfer analysis revealed a dual mechanism in the bimodal benefit: The tone representing F0 provided voicing and manner information, whereas LP provided additional manner, place, and vowel formant information. The data in actual bimodal subjects also showed that the degree of the bimodal benefit depended on the cutoff and slope of residual acoustic hearing.


Figures

Figure 1
Figure 1
Pure-tone thresholds for the actual bimodal subjects. Also plotted are the actual bimodal group mean and the simulated hearing loss (fourth order Butterworth filter with a lowpass cutoff at 500 Hz) provided to the simulated bimodal group. This demonstrates the differences in the effective slope of hearing loss for the two groups, particularly between 125 and 1000 Hz.
Figure 2
Figure 2
Vowel recognition mean scores for (a) the actual bimodal group and (b) the simulated bimodal group for each listening condition in quiet and in noise. Stars indicate statistical significance (p<0.05) with respect to the CI condition. Error bars represent mean standard error. Note that TF0-env is not plotted in the right panels because this condition was not tested at 0 dB SNR; see the left panel for TF0-env scores in quiet.
Figure 3
Figure 3
Information transfer results of the actual bimodal group for vowel recognition in noise. The features of interest are vowel duration (Dur), first formant frequency (F1) and second formant frequency (F2). Stars indicate statistical significance (p<0.05) with respect to the CI condition. Error bars represent mean standard error.
Figure 4
Figure 4
Consonant recognition mean scores for (a) the actual bimodal group and (b) the simulated bimodal group for each listening condition in quiet and in noise. The CI + LP Q condition is also plotted for the actual bimodal group in noise. Stars indicate statistical significance (p<0.05) with respect to the CI condition. Error bars represent mean standard error. Note that the LP Q and TF0-env conditions are not included in the right panels because these conditions were only tested in quiet; refer to the left panels for these scores.
Figure 5
Figure 5
Information transfer results of both groups for consonant recognition at 0 dB SNR. The features of interest are voicing, manner of articulation and place of articulation. Stars indicate statistical significance (p<0.05) with respect to the CI condition. Error bars represent mean standard error.
Figure 6
Figure 6
Sequential information transfer results of the actual bimodal group for consonant recognition at 0 dB SNR, concentrating on the contributions of the TF0-env signal to manner of articulation cues. The features of interest are plosive, fricative, affricate, nasal, and glide. Results shown are second iteration of analysis with influences from the voicing feature removed. The CI + LP Q and LP (quiet) conditions are also plotted for comparison. Stars indicate statistical significance (p<0.05) with respect to the CI condition. Error bars represent mean standard error.

Similar articles

Cited by

References

    1. Armstrong, M., Pegg, P., James, C., and Blamey, P. (1997). “Speech perception in noise with implant and hearing aid,” Am. J. Otolaryngol. 18(6, Suppl.), S140–S141. - PubMed
    1. Assmann, P. F., and Summerfield, Q. (1990). “Modeling the perception of concurrent vowels: Vowels with different fundamental frequencies,” J. Acoust. Soc. Am. 88, 680–697. 10.1121/1.399772 - DOI - PubMed
    1. Blunstein, S. E., and Stevens, K. N. (1980). “Perceptual invariance and onset spectra for stop consonants in different vowel environments,” J. Acoust. Soc. Am. 67(2), 648–662. 10.1121/1.383890 - DOI - PubMed
    1. Boothroyd, A., Hnath-Chisolm, T., Hanin, L., and Kishon-Rabin, L. (1988). “Voice fundamental frequency as an auditory supplement to the speechreading of sentences,” Ear Hear. 9, 306–312. 10.1097/00003446-198812000-00006 - DOI - PubMed
    1. Breeuwer, M., and Plomp, R. (1986). “Speechreading supplemented with auditorily presented speech parameters,” J. Acoust. Soc. Am. 79, 481–499. 10.1121/1.393536 - DOI - PubMed

Publication types

MeSH terms