Clinical Trial
. 2012 Apr 1;185(7):769-78.
doi: 10.1164/rccm.201108-1548OC. Epub 2012 Jan 26.

A phase IIa trial of the new tuberculosis vaccine, MVA85A, in HIV- and/or Mycobacterium tuberculosis-infected adults

Affiliations
Clinical Trial

A phase IIa trial of the new tuberculosis vaccine, MVA85A, in HIV- and/or Mycobacterium tuberculosis-infected adults

Thomas J Scriba et al. Am J Respir Crit Care Med. .

Abstract

Rationale: Novel tuberculosis (TB) vaccines should be safe and effective in populations infected with Mycobacterium tuberculosis (M.tb) and/or HIV for effective TB control.

Objective: To determine the safety and immunogenicity of MVA85A, a novel TB vaccine, among M.tb- and/or HIV-infected persons in a setting where TB and HIV are endemic.

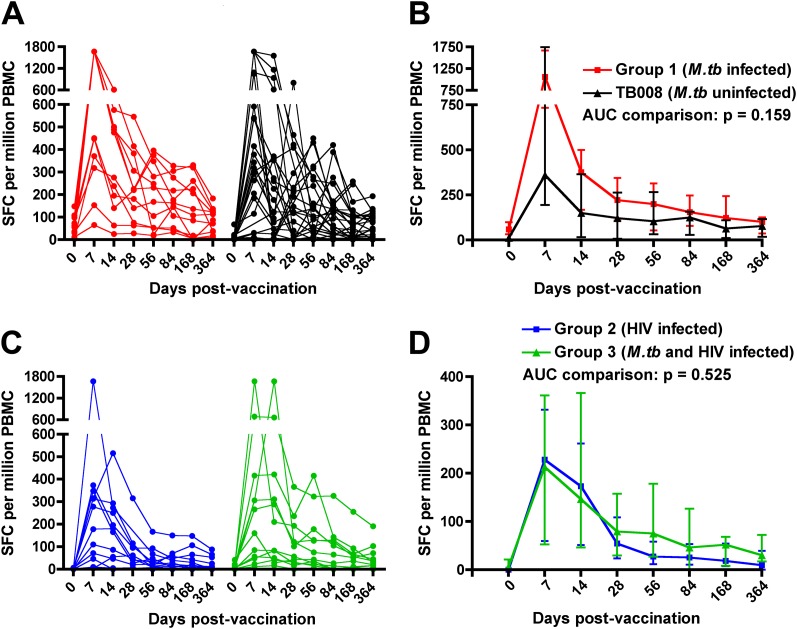
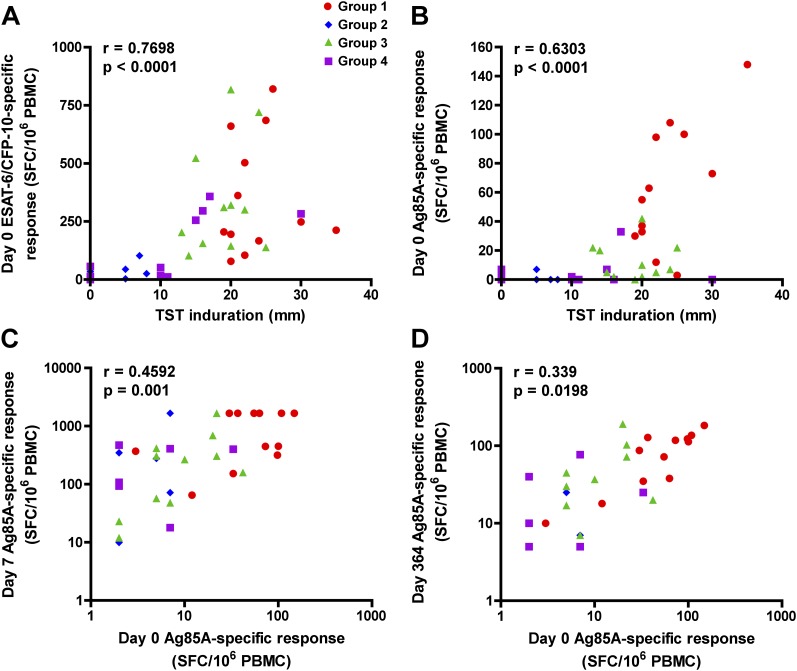
Methods: An open-label, phase IIa trial was conducted in 48 adults with M.tb and/or HIV infection. Safety and immunogenicity were analyzed up to 52 weeks after intradermal vaccination with 5 × 10(7) plaque-forming units of MVA85A. Specific T-cell responses were characterized by IFN-γ enzyme-linked immunospot and whole blood intracellular cytokine staining assays.

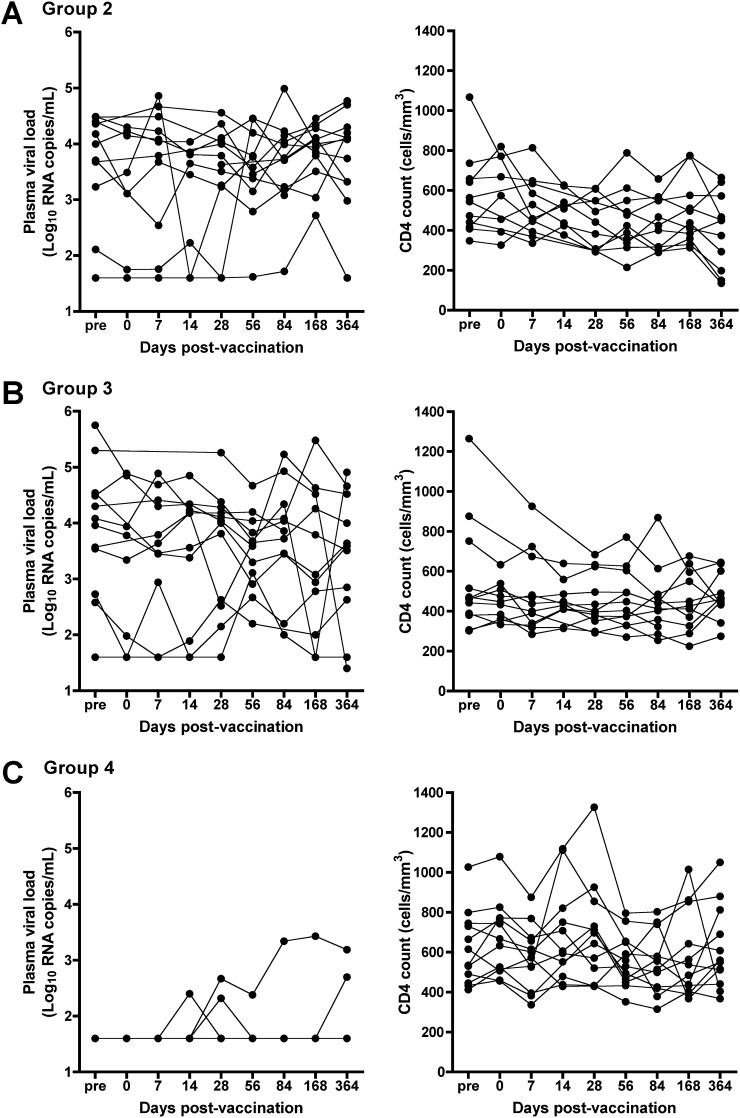
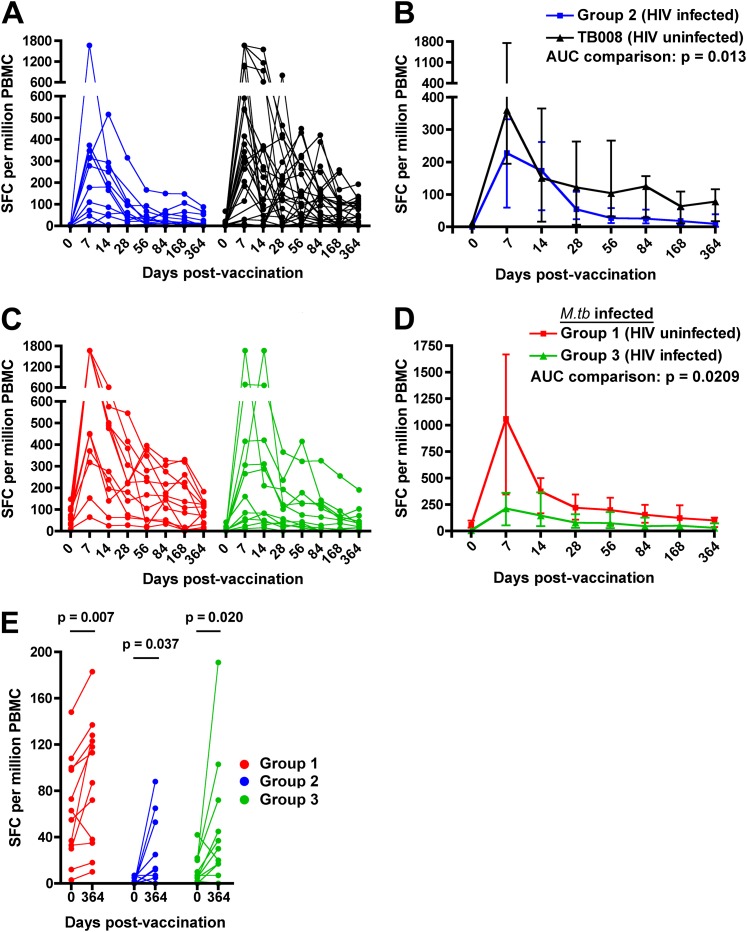
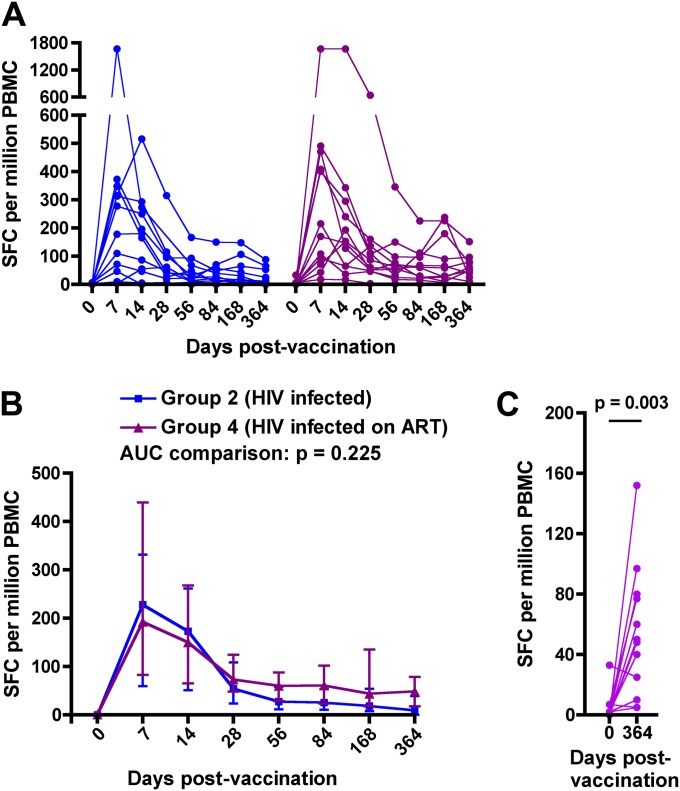
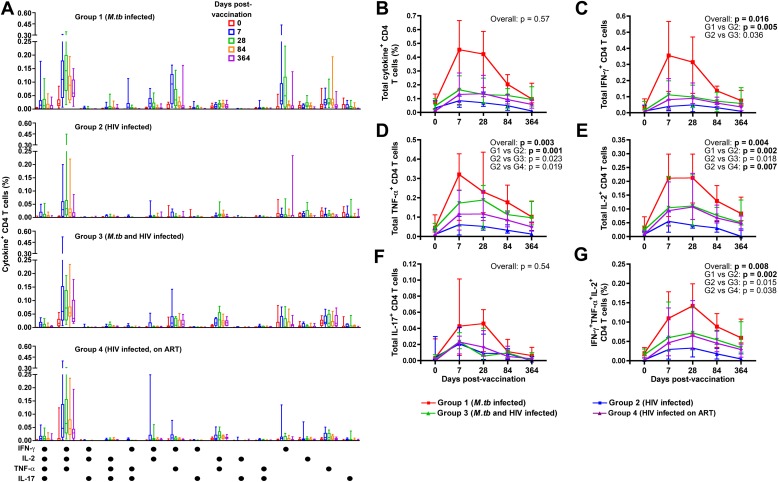
Measurements and main results: MVA85A was well tolerated and no vaccine-related serious adverse events were recorded. MVA85A induced robust and durable response of mostly polyfunctional CD4(+) T cells, coexpressing IFN-γ, tumor necrosis factor-α, and IL-2. Magnitudes of pre- and postvaccination T-cell responses were lower in HIV-infected, compared with HIV-uninfected, vaccinees. No significant effect of antiretroviral therapy on immunogenicity of MVA85A was observed.

Conclusions: MVA85A was safe and immunogenic in persons with HIV and/or M.tb infection. These results support further evaluation of safety and efficacy of this vaccine for prevention of TB in these target populations.

Trial registration: ClinicalTrials.gov NCT00480558.


Figures

Figure 1.
Figure 1.
Plasma HIV RNA load and CD4 counts before and after MVA85A vaccination in HIV-infected individuals from (A) group 2, (B) group 3, and (C) group 4. For individuals in group 4, plasma viral load (pVL) and CD4 counts recorded by their regular physicians before enrollment into this trial are shown as prevaccination (pre-) visits. Individual vaccinees are represented by each line.
Figure 2.
Figure 2.
Effect of underlying Mycobacterium tuberculosis (M.tb) infection on Ag85A-specific IFN-γ enzyme-linked immunospot (ELISPOT) responses in adults who received a single intradermal dose of 5 × 10⁷ plaque-forming units of MVA85A. (A) Longitudinal responses in individual participants from group 1 (n = 12, M.tb infected) and M.tb-uninfected adults from trial TB008 (n = 24 [16]). All 12 group 1 participants had positive IFN-γ ELISPOT responses to Ag85A 7 days postvaccination (a stringent cutoff for positive response of 50 spot-forming cells [SFCs] per million peripheral blood mononuclear cells [PBMCs] was applied). (B) Medians (lines) and interquartile ranges (IQR, error bars) of Ag85A-specific IFN-γ ELISPOT responses. (C) Longitudinal responses in individual participants from group 2 (n = 12, HIV infected, M.tb uninfected) and group 3 (n = 12, M.tb and HIV infected). Nine participants from each group had positive IFN-γ ELISPOT responses to Ag85A 7 days postvaccination. (D) Medians (lines) and IQRs (error bars) of Ag85A-specific IFN-γ ELISPOT responses. Area under curve (AUC) comparisons of the groups were evaluated by Mann-Whitney U test. An adjusted P value of less than 0.025 was considered significant.
Figure 3.
Figure 3.
Effect of underlying HIV infection on MVA85A-induced Ag85A-specific IFN-γ enzyme-linked immunospot (ELISPOT) responses. (A) Longitudinal responses in individual participants from group 2 (n = 12, HIV infected) and HIV-uninfected adults from trial TB008 (n = 24 [16]). (B) Medians (lines) and interquartile ranges (IQR, error bars) of Ag85A-specific IFN-γ ELISPOT responses. (C) Longitudinal responses in individual participants from group 1 (n = 12, HIV uninfected, Mycobacterium tuberculosis [M.tb] infected) and group 3 (n = 12, M.tb and HIV infected). (D) Medians (lines) and IQRs (error bars) of Ag85A-specific IFN-γ ELISPOT responses. Area under curve (AUC) comparisons of the groups were evaluated by Mann-Whitney U test. An adjusted P value of less than 0.025 was considered significant for the AUC comparisons. (E) Comparisons between the Ag85A-specific T-cell response before (Day 0) and 1 year after (Day 364) MVA85A vaccination. Differences were evaluated by Wilcoxon matched pairs test and a P value less than 0.05 was considered significant. SFC = spot-forming cells.
Figure 4.
Figure 4.
Effect of antiretroviral treatment in HIV-infected adults on MVA85A-induced Ag85A-specific IFN-γ enzyme-linked immunospot (ELISPOT) responses. (A) Longitudinal responses in individual participants from group 2 (n = 12, HIV infected) and group 4 (n = 12, HIV infected, receiving antiretroviral therapy [ART]). Ten group 4 participants had positive IFN-γ ELISPOT responses to Ag85A 7 days postvaccination. (B) Medians (lines) and IQRs (error bars) of Ag85A-specific IFN-γ ELISPOT responses. Area under curve (AUC) comparisons of the groups were evaluated by Mann-Whitney U test. An adjusted P value of less than 0.025 was considered significant for the AUC comparisons. (C) Comparisons between the Ag85A-specific T-cell response before (Day 0) and 1 year after (Day 364) MVA85A vaccination in group 4 (n = 12, HIV infected, receiving ART). Differences were evaluated by Wilcoxon matched pairs test. SFC = spot-forming cells.
Figure 5.
Figure 5.
The degree of sensitization to Mycobacterium tuberculosis (M.tb) is an important determinant in the MVA85A-induced T-cell response. (A) Association between size of tuberculin skin test (TST) induration, measured at screening, and the summed early secretory antigenic target (ESAT)-6 and culture filtrate protein (CFP)-10–specific T-cell response, measured before MVA85A vaccination by IFN-γ enzyme-linked immunospot (ELISPOT) assay. (B) Association between size of TST induration and the Ag85A-specific T-cell response before MVA85A vaccination. (C) Association between the Ag85A-specific T-cell response before and 7 days after MVA85A vaccination. (D) Association between the Ag85A-specific T-cell response before and 1 year (364 d) after MVA85A vaccination. For (AD), data from participants in all four groups were combined. Correlations were assessed by Spearman correlation test.
Figure 6.
Figure 6.
Ag85A-specific CD4 T-cell cytokine expression in whole blood measured before and after MVA85A vaccination by flow cytometry. (A) The graphs show patterns of single or combined expression of IFN-γ, IL-2, tumor necrosis factor (TNF)-α , and/or IL-17 by CD4 T cells from adults in group 1 (Mycobacterium tuberculosis [M.tb] infected, n = 12), group 2 (HIV infected, n = 12), group 3 (M.tb and HIV infected, n = 12), and group 4 (HIV infected, receiving antiretroviral therapy [ART], n = 12). The median frequency for each cytokine-expressing cell subset is represented by the horizontal line, the interquartile range (IQR) by the box, and the range by the whiskers. For each pattern, in each individual, background values (unstimulated) were subtracted. Each box plot represents a particular time point pre- or postvaccination, for the indicated cytokine-expressing cell subset. (BG) Medians (lines) and IQRs (error bars) of Ag85A-specific CD4 T-cell frequencies measured before and after MVA85A vaccination in the four groups. (B) Total cytokine-expressing CD4 T cells. (C) Total IFN-γ–expressing CD4 T cells. (D) Total TNF-α–expressing CD4 T cells. (E) Total IL-2–expressing CD4 T cells. (F) Total IL-17–expressing CD4 T cells. (G) Polyfunctional CD4 T cells, coexpressing IFN-γ, TNF-α, and IL-2. Comparisons of area under curve (AUC) values for the groups were evaluated by Kruskal-Wallis test (overall effect), followed by the Mann-Whitney U test. An adjusted P value of less than 0.0083 (Bonferroni adjustment, 0.05 × 6) was considered significant. Significant differences are shown in boldface.

References

    1. Corbett EL, Watt CJ, Walker N, Maher D, Williams BG, Raviglione MC, Dye C. The growing burden of tuberculosis: global trends and interactions with the HIV epidemic. Arch Intern Med 2003;163:1009–1021 - PubMed
    1. Lawn SD, Myer L, Edwards D, Bekker LG, Wood R. Short-term and long-term risk of tuberculosis associated with CD4 cell recovery during antiretroviral therapy in South Africa. AIDS 2009;23:1717–1725 - PMC - PubMed
    1. Abu-Raddad LJ, Sabatelli L, Achterberg JT, Sugimoto JD, Longini IM, Jr, Dye C, Halloran ME. Epidemiological benefits of more-effective tuberculosis vaccines, drugs, and diagnostics. Proc Natl Acad Sci USA 2009;106:13980–13985 - PMC - PubMed
    1. Dye C, Williams BG. Eliminating human tuberculosis in the twenty-first century. J R Soc Interface 2008;5:653–662 - PMC - PubMed
    1. Rodrigues LC, Diwan VK, Wheeler JG. Protective effect of BCG against tuberculous meningitis and miliary tuberculosis: a meta-analysis. Int J Epidemiol 1993;22:1154–1158 - PubMed

Publication types

MeSH terms

Associated data