

DNA sequencing of maternal plasma reliably identifies trisomy 18 and trisomy 13 as well as Down syndrome: an international collaborative study
- PMID: 22281937
- PMCID: PMC3938175
- DOI: 10.1038/gim.2011.73
DNA sequencing of maternal plasma reliably identifies trisomy 18 and trisomy 13 as well as Down syndrome: an international collaborative study
Abstract
Purpose: To determine whether maternal plasma cell-free DNA sequencing can effectively identify trisomy 18 and 13.
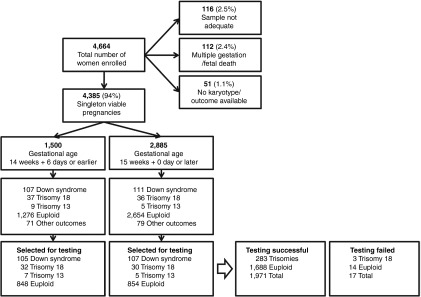
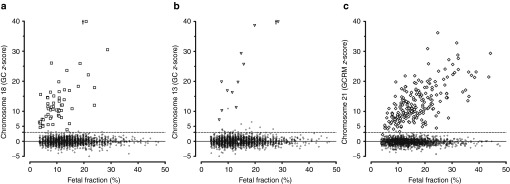
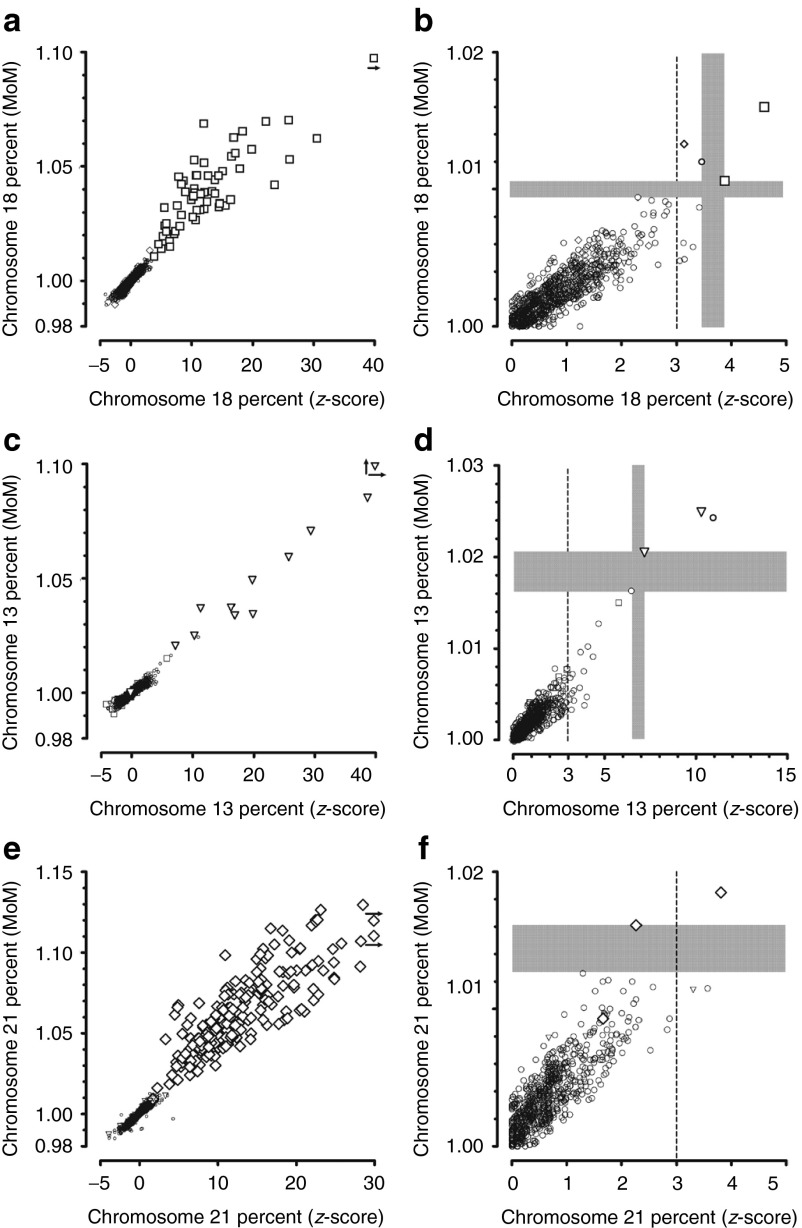
Methods: Sixty-two pregnancies with trisomy 18 and 12 with trisomy 13 were selected from a cohort of 4,664 pregnancies along with matched euploid controls (including 212 additional Down syndrome and matched controls already reported), and their samples tested using a laboratory-developed, next-generation sequencing test. Interpretation of the results for chromosome 18 and 13 included adjustment for CG content bias.
Results: Among the 99.1% of samples interpreted (1,971/1,988), observed trisomy 18 and 13 detection rates were 100% (59/59) and 91.7% (11/12) at false-positive rates of 0.28% and 0.97%, respectively. Among the 17 samples without an interpretation, three were trisomy 18. If z-score cutoffs for trisomy 18 and 13 were raised slightly, the overall false-positive rates for the three aneuploidies could be as low as 0.1% (2/1,688) at an overall detection rate of 98.9% (280/283) for common aneuploidies. An independent academic laboratory confirmed performance in a subset.
Conclusion: Among high-risk pregnancies, sequencing circulating cell-free DNA detects nearly all cases of Down syndrome, trisomy 18, and trisomy 13, at a low false-positive rate. This can potentially reduce invasive diagnostic procedures and related fetal losses by 95%. Evidence supports clinical testing for these aneuploidies.
Figures
References
-
- Savva GM, Walker K, Morris JK. The maternal age-specific live birth prevalence of trisomies 13 and 18 compared to trisomy 21 (Down syndrome) Prenat Diagn. 2010;30:57–64. - PubMed
-
- Data Access—Vital Statistics Online. Centers for Disease Control and Prevention http://www.cdc.gov/nchs/data_access/Vitalstatsonline.htm. Accessed November 2011.
-
- Morris JK, Savva GM. The risk of fetal loss following a prenatal diagnosis of trisomy 13 or trisomy 18. Am J Med Genet A. 2008;146:827–832. - PubMed
-
- Nembhard WN, Waller DK, Sever LE, Canfield MA. Patterns of first-year survival among infants with selected congenital anomalies in Texas, 1995–1997. Teratology. 2001;64:267–275. - PubMed
-
- Rasmussen SA, Wong LY, Yang Q, May KM, Friedman JM. Population-based analyses of mortality in trisomy 13 and trisomy 18. Pediatrics. 2003;111:777–784. - PubMed
Publication types
MeSH terms
Substances
LinkOut - more resources
Full Text Sources
Other Literature Sources
Medical
