. 2012 Mar;26(3):372-84.
doi: 10.1210/me.2011-1274. Epub 2012 Jan 26.

The nuclear receptor, Nor-1, markedly increases type II oxidative muscle fibers and resistance to fatigue

Affiliations

The nuclear receptor, Nor-1, markedly increases type II oxidative muscle fibers and resistance to fatigue

Michael A Pearen et al. Mol Endocrinol. 2012 Mar.

Abstract

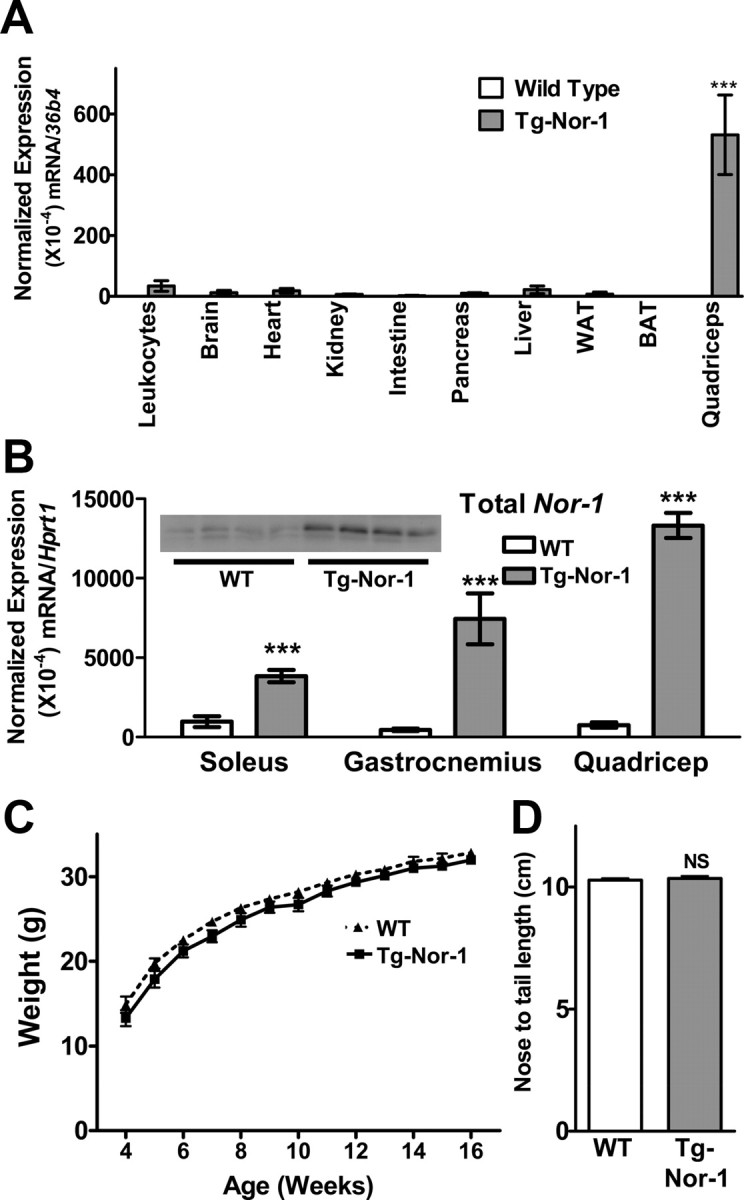
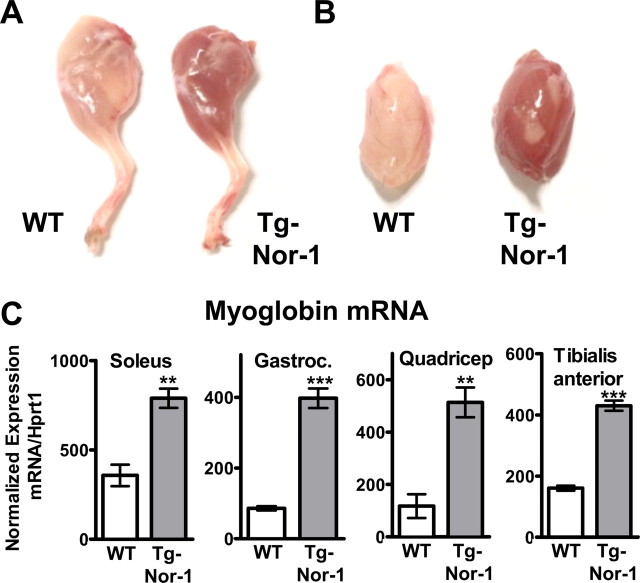
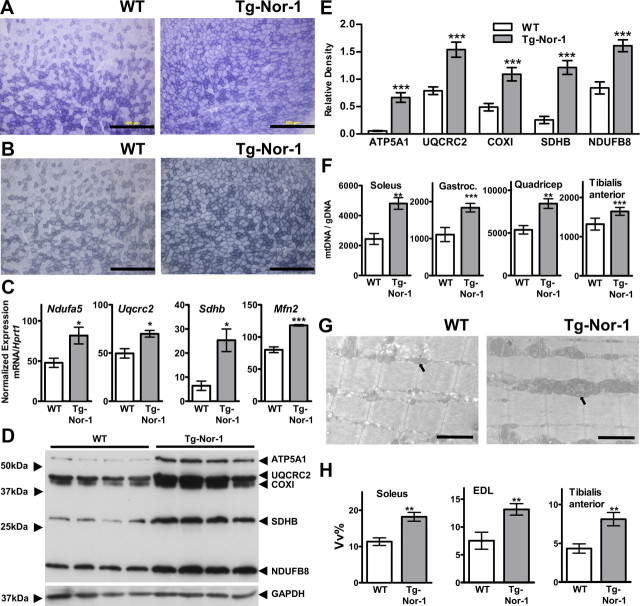
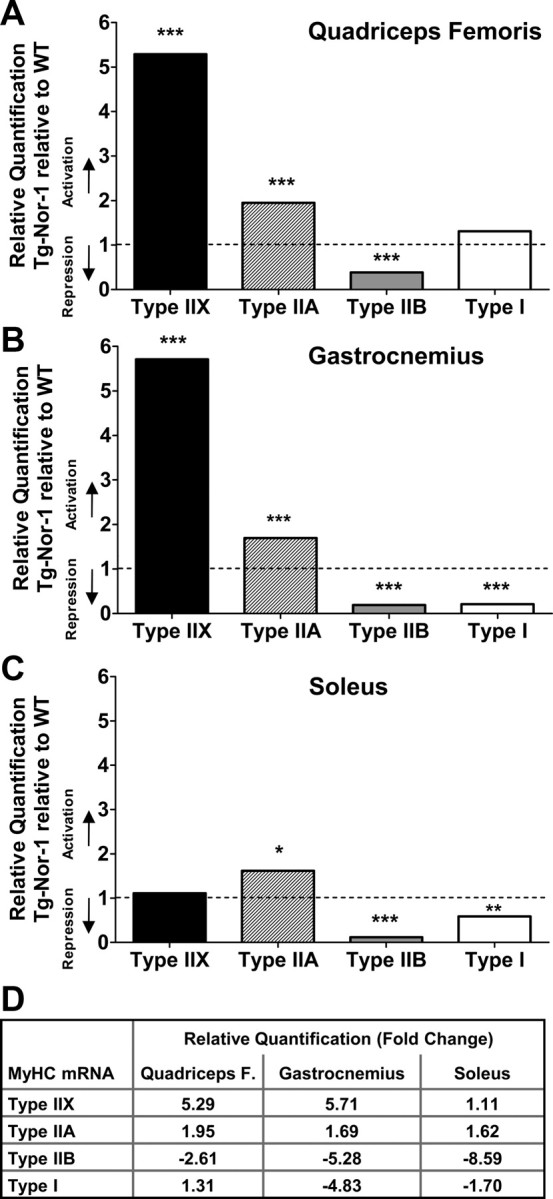
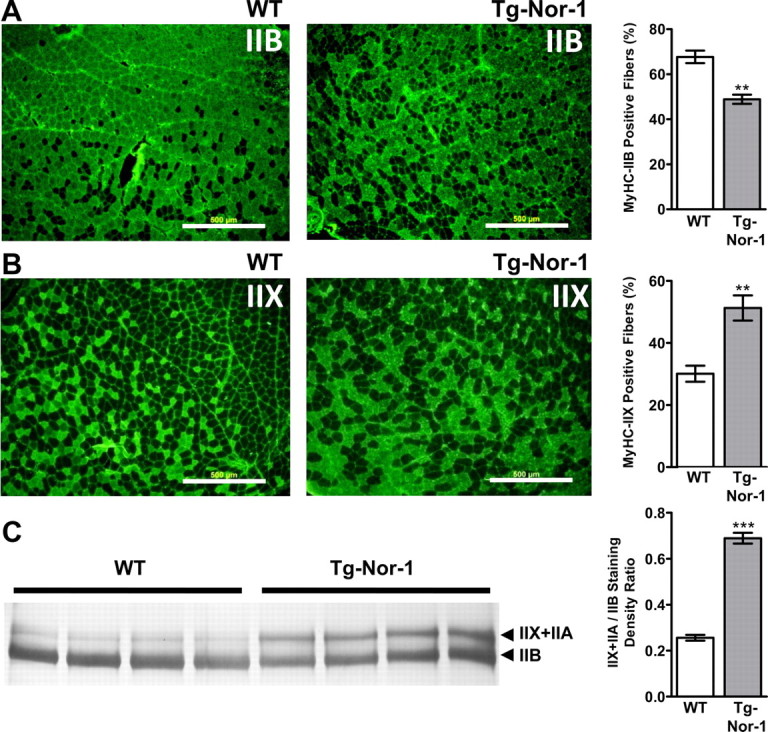
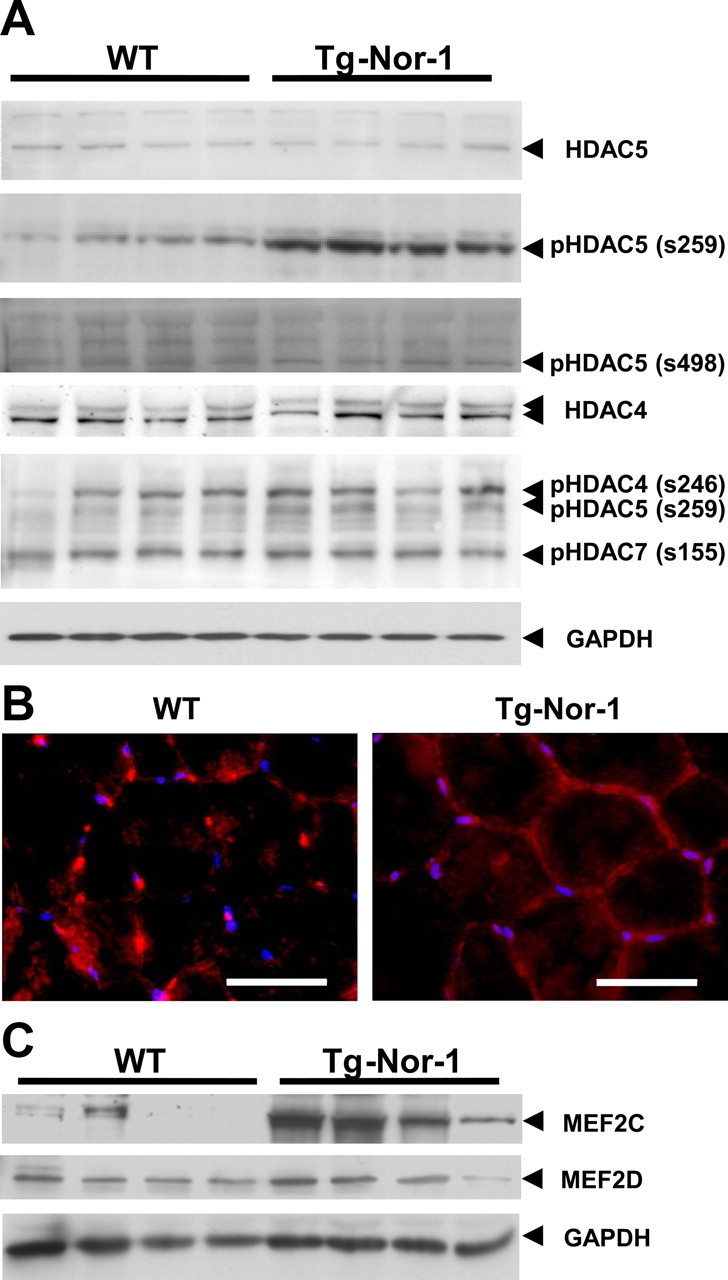
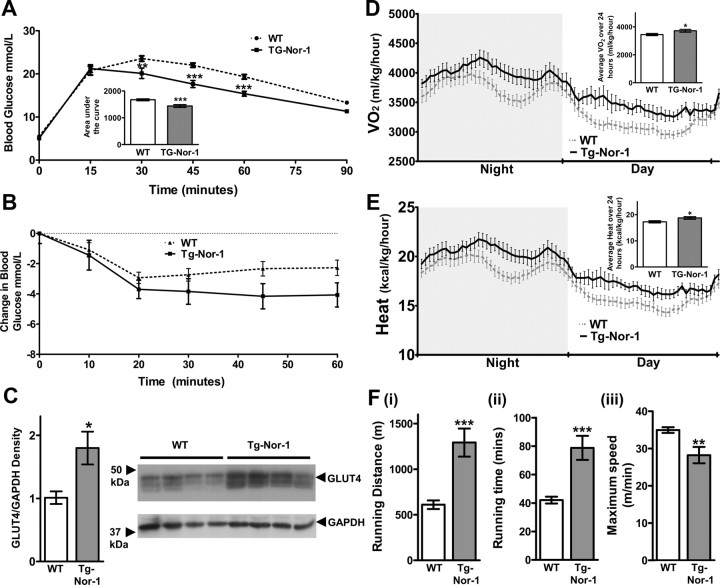
Nuclear hormone receptors (NR) have been implicated as regulators of lipid and carbohydrate metabolism. The orphan NR4A subgroup has emerged as regulators of metabolic function. Targeted silencing of neuron-derived orphan receptor 1 (Nor-1)/NR4A3 in skeletal muscle cells suggested that this NR was necessary for oxidative metabolism in vitro. To investigate the in vivo role of Nor-1, we have developed a mouse model with preferential expression of activated Nor-1 in skeletal muscle. In skeletal muscle, this resulted in a marked increase in: 1) myoglobin expression, 2) mitochondrial DNA and density, 3) oxidative enzyme staining, and 4) genes/proteins encoding subunits of electron transport chain complexes. This was associated with significantly increased type IIA and IIX myosin heavy chain mRNA and proteins and decreased type IIB myosin heavy chain mRNA and protein. The contractile protein/fiber type remodeling driving the acquisition of the oxidative type II phenotype was associated with 1) the significantly increased expression of myocyte-specific enhancer factor 2C, and phospho-histone deacetylase 5, and 2) predominantly cytoplasmic HDAC5 staining in the Tg-Nor-1 mice. Moreover, the Nor-1 transgenic line displayed significant improvements in glucose tolerance, oxygen consumption, and running endurance (in the absence of increased insulin sensitivity), consistent with increased oxidative capacity of skeletal muscle. We conclude that skeletal muscle fiber type is not only regulated by exercise-sensitive calcineurin-induced signaling cascade but also by NR signaling pathways that operate at the nexus that coordinates muscle performance and metabolic capacity in this major mass tissue.


Figures

Fig. 1.
Fig. 1.
Expression of endogenous/ectopic Nor-1. A, Multiple tissues were assayed to determine the mRNA expression of the Nor-1 transgene in WT and transgenic (Tg-Nor-1) mice (n = 3). Statistical significance was assessed using a one-way ANOVA with Dunnett's post hoc test to compare the skeletal muscle sample (quadriceps femoris). B, Expression of total Nor-1 mRNA in soleus, gastrocnemius, and quadriceps femoris from WT and transgenic mice (n = 4–8). Statistical significance was assessed using a one-way ANOVA with Bonferroni's post hoc test. Total NOR-1 protein expression in quadriceps femoris muscle was determined by Western blotting (n = 4; B, inset). Weight (C) and length (D) of WT and transgenic mice (n = 12–16). ***, P < 0.001. NS, Nonsignificant. WAT, White adipose tissue; BAT, brown adipose tissue.
Fig. 2.
Fig. 2.
Increased myoglobin expression in the skeletal muscle of Nor-1 transgenic mice. Representative photograph of whole back leg (A) and isolated gastrocnemius muscle (B) from WT and transgenic (Tg-Nor-1) mice. C, Skeletal muscle myoglobin mRNA levels were assayed by qRT-PCR in soleus, gastrocnemius (Gastroc.), quadriceps femoris, and tibialis anterior in WT and transgenic mice (n = 4–8). **, P < 0.01; ***, P < 0.001.
Fig. 3.
Fig. 3.
Skeletal muscle from Nor-1 transgenic mice display elevated mitochondrial markers. Brightfield microphotograph of transverse tibialis anterior cryosections from WT and transgenic (Tg-Nor-1) mice after SDH staining (A) and NADH staining (B). Representative microphotographs are shown (n = 3). Scale bar, 500 μm. C, The mRNA expression of functional mitochondrial genes Ndufa5, Uqcrc2, Sdhb, and Mfn2 in quadriceps femoris skeletal muscle was assayed by qRT-PCR (n = 4). D, Western blotting of key proteins involved in oxidative phosphorylation with (E) quantification by densitometry. Statistical significance was assessed using a one-way ANOVA with Bonferroni's post hoc test. F, mtDNA content was compared relative to gDNA content using qRT-PCR in soleus, gastrocnemius (Gastroc.), quadriceps femoris, and tibialis anterior (n = 4–6). G, Representative (n = 3) transmission electron micrograph of EDL from WT and transgenic mice. Arrow points to mitochondria. Scale bar, 2 μm. H, Analysis of mitochondria Vv% was derived from transmission electron microscopy for soleus, EDL, and tibialis anterior (n = 3). COX1, Cytochrome c oxidase subunit 1. *, P < 0.05; **, P < 0.01; ***, P < 0.001.
Fig. 4.
Fig. 4.
Expression of the Nor-1 transgene in mouse skeletal muscle alters the mRNA expression of MyHC isoforms. The mRNA expression of MyHC isoforms (MyHC IIX, IIA, IIB, and I, corresponding to mRNA Myh1, Myh2, Myh4, and Myh7, respectively) was assayed using qRT-PCR in quadriceps femoris (A), gastrocnemius (B), and soleus skeletal muscle (C) (n = 5–8). qRT-PCR was processed using Integromics StatMiner software suite and normalized to 18S rRNA. D, Table summarizing type IIX, IIA, IIB, and I MyHC mRNA fold activation and repression in quadriceps femoris (F), gastrocnemius, and soleus (for complete data of statistical analysis, see Supplemental Table 1). *, P < 0.05; **, P < 0.01; ***, P < 0.001.
Fig. 5.
Fig. 5.
Nor-1 transgenic mice display alterations in MyHC isoform proteins. Immunofluorescence was used to detect skeletal muscle fibers expressing MyHC IIB (A) and MyHC IIX (B) on transverse tibialis anterior cryosections from WT and transgenic (Tg-Nor-1) mice. Representative microphotographs (n = 3) are shown. Scale bar, 500 μm. Positive staining fibers were manually counted and calculated as percentage. C, High-resolution SDS-PAGE of MyHC isoforms from quadriceps femoris in WT and transgenic mice (n = 4) with quantification by densitometry. **, P < 0.01; ***, P < 0.001.
Fig. 6.
Fig. 6.
Phosphorylation of HDAC5 is enhanced in Nor-1 transgenic mice. A, Western blotting of quadriceps femoris protein extract from WT and transgenic (Tg-Nor-1) mice (n = 4). Specific antibodies were used to detect total HDAC5, phospho-HDAC5 (Ser259 and Ser498), HDAC4, phospho-pHDAC4/5/7 (Ser246/259/155, respectively), and GAPDH (loading control). B, Immunofluorescence was used to localize HDAC5 (red) in transverse tibialis anterior cryosections from WT and transgenic (Tg-Nor-1) mice with 4′,6-diamidino-2-phenylindole (DAPI) nuclear stain (blue). Representative microphotographs (n = 3) are shown. Scale bar, 50 μm. C, Specific antibodies were used to detect MEF2C, MEF2D, and GAPDH (loading control).
Fig. 7.
Fig. 7.
Expression of the Nor-1 transgene in mouse skeletal muscle alters blood glucose clearance and enhances running endurance. Glucose (A) and insulin (B) tolerance measured via blood glucose levels were compared in both WT and transgenic (TG-Nor-1) mice (n = 12–16). Statistical significance was assessed using a one-way ANOVA with Bonferroni's post hoc test. Area under the curve was determined for GTT (A, inset). C, The protein levels of GLUT4 and GAPDH were determined via Western blotting with quantification by densitometry. D, Oxygen consumption volume (VO2) corrected for body weight in WT and transgenic mice (n = 7–12). Average oxygen consumption volume corrected for body weight over 24 h (D, inset). E, Indirect calorimetry was used to calculate heat production corrected for body weight (n = 7–12). Average heat production corrected for body weight over 24 h (E, inset). F, Small animal treadmill was used to measure (i) running endurance distance, (ii) running time, and (iii) maximum running speed in WT and transgenic mice (n = 4). *, P < 0.05; **, P < 0.01; ***, P < 0.001.

References

    1. Chawla A , Repa JJ , Evans RM , Mangelsdorf DJ. 2001. Nuclear receptors and lipid physiology: opening the X-files. Science 294:1866–1870 - PubMed
    1. Wilson TE , Fahrner TJ , Johnston M , Milbrandt J. 1991. Identification of the DNA binding site for NGFI-B by genetic selection in yeast. Science 252:1296–1300 - PubMed
    1. Wansa KD , Harris JM , Yan G , Ordentlich P , Muscat GE. 2003. The AF-1 domain of the orphan nuclear receptor NOR-1 mediates trans-activation, coactivator recruitment, and activation by the purine anti-metabolite 6-mercaptopurine. J Biol Chem 278:24776–24790 - PubMed
    1. Chintharlapalli S , Burghardt R , Papineni S , Ramaiah S , Yoon K , Safe S. 2005. Activation of Nur77 by selected 1,1-Bis(3′-indolyl)-1-(p-substituted phenyl)methanes induces apoptosis through nuclear pathways. J Biol Chem 280:24903–24914 - PubMed
    1. Zhan Y , Du X , Chen H , Liu J , Zhao B , Huang D , Li G , Xu Q , Zhang M , Weimer BC , Chen D , Cheng Z , Zhang L , Li Q , Li S , Zheng Z , Song S , Huang Y , Ye Z , Su W , Lin SC , Shen Y , Wu Q. 2008. Cytosporone B is an agonist for nuclear orphan receptor Nur77. Nat Chem Biol 4:548–556 - PubMed

Publication types

MeSH terms