. 2012 Mar 9;335(6073):1238-42.
doi: 10.1126/science.1214956. Epub 2012 Jan 26.

Unique processing during a period of high excitation/inhibition balance in adult-born neurons

Affiliations

Unique processing during a period of high excitation/inhibition balance in adult-born neurons

Antonia Marín-Burgin et al. Science. .

Abstract

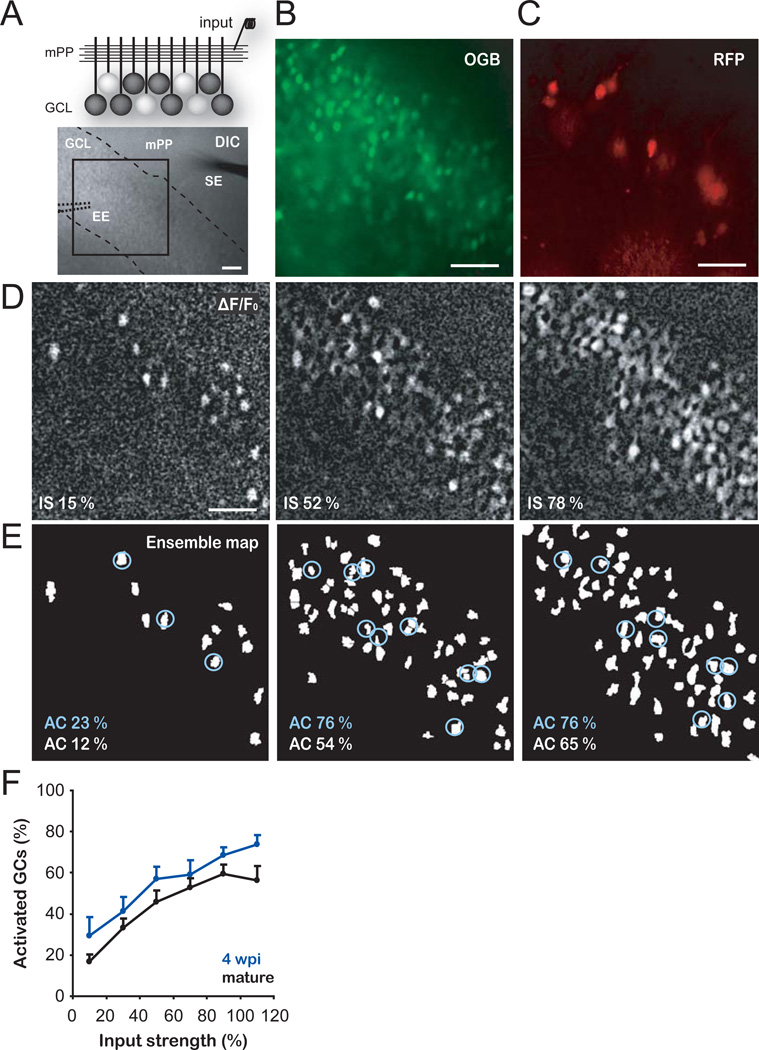
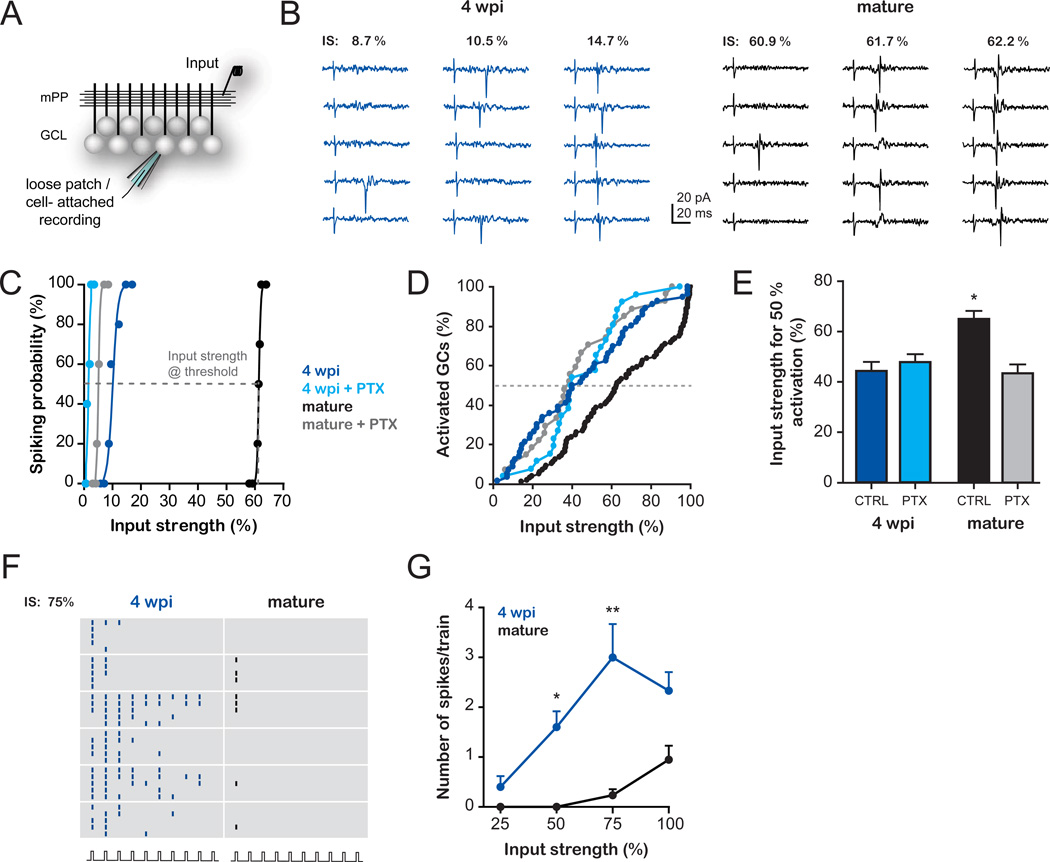
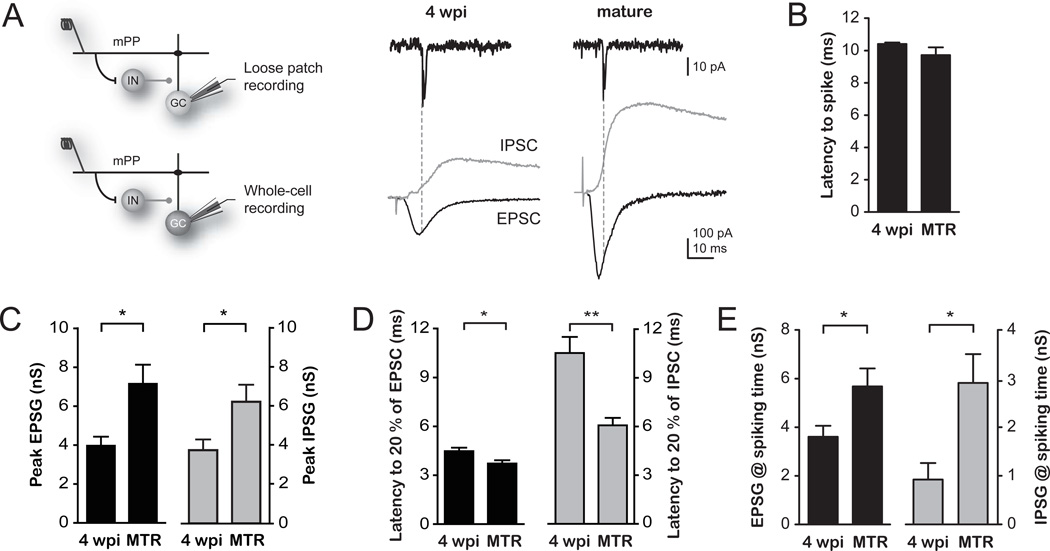
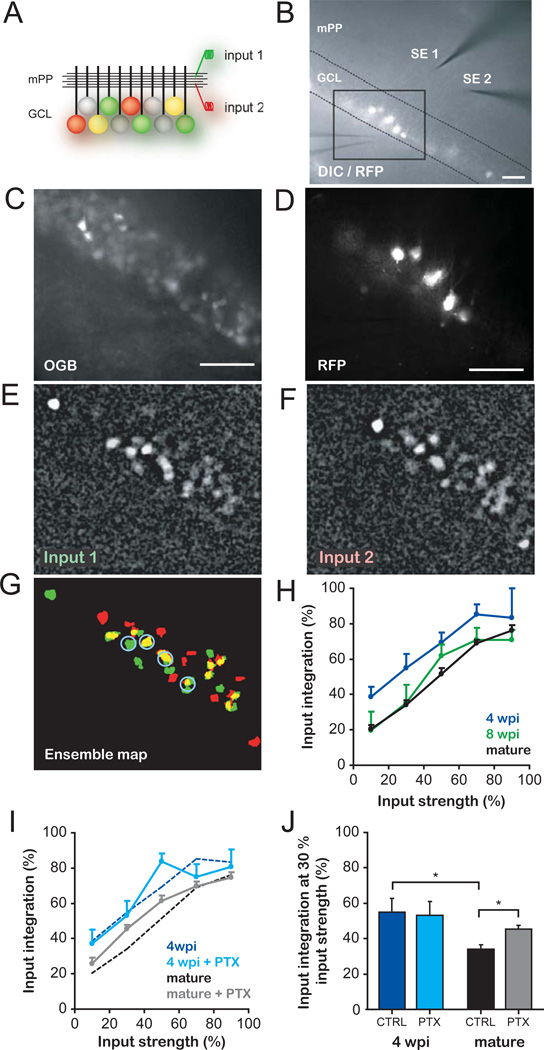
The adult dentate gyrus generates new granule cells (GCs) that develop over several weeks and integrate into the preexisting network. Although adult hippocampal neurogenesis has been implicated in learning and memory, the specific role of new GCs remains unclear. We examined whether immature adult-born neurons contribute to information encoding. By combining calcium imaging and electrophysiology in acute slices, we found that weak afferent activity recruits few mature GCs while activating a substantial proportion of the immature neurons. These different activation thresholds are dictated by an enhanced excitation/inhibition balance transiently expressed in immature GCs. Immature GCs exhibit low input specificity that switches with time toward a highly specific responsiveness. Therefore, activity patterns entering the dentate gyrus can undergo differential decoding by a heterogeneous population of GCs originated at different times.


Figures

Fig. 1
Fig. 1. Enhanced activation of immature GCs
(A) Top, schematic view of the experimental configuration for calcium imaging of neuronal ensembles in the granule cell layer (GCL). A stimulating electrode activates the mPP input. White cell bodies denote GCs spiking in response to mPP stimulation. Bottom, DIC image of a hippocampal slice showing the GCL (dashed lines), a stimulating electrode (SE) placed in the mPP and the position of the extracellular electrode (EE, dotted lines) used to record population activity for input normalization (Fig. S2A–C). The calcium indicator OGB-1AM was loaded in the GCL and the boxed area was used for time-lapse imaging. (B,C) Larger magnification depicting the imaged area with all OGB-1 AM loaded GCs (B) and 4 wpi (RFP+) GCs (C). (D) Representative experiment displaying neuronal ensembles activated at increasing input strengths (IS, assessed as % fEPSPslope, see S.O.M. and Fig. S2A–C). Images are averages of peak ΔF/F0 of 5 trials from the same slice shown in A–C. (E) Ensemble maps corresponding to the panels shown in D (see S.O.M. and Fig. S1). The percentage of active cells (AC) is indicated for mature (RFP, white labels) or 4 wpi GCs (RFP+, circled cells, blue labels). (F) Percentage of activated cells as a function of input strength. Immature GCs (n = 4–14 slices per bin) displayed higher levels of activation than mature GCs (n = 5–18) (p < 0.01, two-way ANOVA). Data was binned every 20 % input strength. Scale bars, 50 µm.
Fig. 2
Fig. 2. Differential influence of inhibitory circuits in the activation of immature and mature GCs
(A–E) Activation of GCs evoked by stimulation of the mPP by single pulses. (A) Schematic diagram depicting the experimental configuration. A stimulating electrode (input) was placed in the mPP and loose patch recordings were performed to measure spiking probability. (B) Example traces of a 4 wpi and a mature GC recorded at increasing input strengths (IS, normalized to the % fEPSPslope, Fig. S2A–C). (C) Example curves of spiking probability versus input strength for 4 wpi and mature GCs in the presence or absence of PTX (100 µM). Sigmoidal curves were fitted to calculate the input strength at threshold (50% spiking probability), as indicated by the dashed line in the example (mature GC). (D) Population activation curves: Cumulative distributions of threshold inputs for 4 wpi and mature GC populations recorded in the absence (4 wpi, n = 56; mature, n = 96) or presence of PTX (4 wpi, n = 26; mature, n = 27). Activation curves of 4 wpi and mature GCs displayed significant differences (p < 0.006, Kolmogorov-Smirnov test). (E) Average input strength that recruits 50 % of the GC population in the absence (CTRL) or presence of PTX. Significantly higher input strengths were required to activate mature GCs in control conditions than in all other groups (*, p < 0.001, post-hoc Bonferroni’s test after one-way ANOVA). (F–G) Activation of GCs evoked by stimulation of the mPP at 10 Hz trains. (F) Raster plot depicting spikes recorded from 4 wpi and mature GCs in response to trains (10 pulses, 10 Hz) delivered at 75 % input strength (five trials/neuron). (G) Train stimulation elicits a higher number of spikes (mean ± SEM) in 4 wpi GCs than in mature GCs at increasing input strengths. (*) and (**) denote p< 0.05 and p < 0.001 after ANOVA and Bonferroni’s post-hoc test (n = 7 immature GCs; n = 6 mature GCs).
Fig. 3
Fig. 3. A differential excitation/inhibition balance underlying the increased activation of immature GCs
(A) Left, Schematic diagram of the recording configuration and activated circuits. Stimulation of the mPP evokes monosynaptic excitation and disynaptic inhibition via GABAergic interneurons (IN) onto GCs. Spiking and synaptic currents were subsequently measured using loose patch followed by whole-cell recordings in individual cells. Right top, example loose patch traces depicting spikes evoked by stimulation of the mPP at threshold intensity in 4 wpi and mature GCs. Right bottom, the underlying EPSCs (black traces) and IPSCs (gray traces) were recorded in whole cell at the reversal potential of the inhibition (-55 and −60 mV, respectively) and excitation (0 mV for both). Dotted lines depict the spiking time after mPP stimulation (see S.O.M.). (B) Latency to spike measured at threshold intensity displayed similar values between 4 wpi and mature GCs. (C) Peak EPSG and IPSG in 4 wpi and mature GCs (*, p < 0.02, t-test). (D) Latency to onset for EPSCs and IPSCs show a profound delay in IPSC onset for 4 wpi neurons (*, p < 0.05; **, p < 0.01, t-test). (E) EPSG and IPSG amplitudes measured at the precise time of evoked spikes (*, p < 0.05 for EPSG and p < 0.03 for IPSG, t-test). n = 4 for all experiments.
Fig. 4
Fig. 4. Enhanced integration of inputs by immature GCs
(A) Schema of the experimental configuration. Stimulating electrodes activate independent mPP inputs. Colored GCs denote spiking elicited by input 1 (red), 2 (green) or both (yellow) when activated separately at similar strengths. (B) DIC/fluorescence overlay images showing 4-wpi GCs (RFP+), stimulating electrodes (SE1, SE2), the extracellular electrode used to assess input independence (Fig. S6), and the boxed area used for imaging. (C,D) Imaged area depicting OGB-1AM loaded cells (C) and RFP+ GCs (D). (E–G) Representative experiment displaying neuronal ensembles activated by input 1 (E) and 2 (F) at similar strengths. Neurons responding to either stimulus (green, red) or both (yellow) are shown in the ensemble map (G). Blue circles indicate active immature GCs. (H) Input integration of recruited ensembles, defined as the proportion of GCs responding to both inputs (activated separately) normalized to the total number of active neurons at each input strength. Input strength was assessed as % of total activated neurons (see S.O.M. and Fig. S2D,E). Four wpi GCs (n = 3–16 slices/value) displayed higher integration values than 8 wpi (n = 5–13) and mature GCs (n = 8–34) throughout the curves (p < 0.01 for both, two-way ANOVA). Data was binned in 20% intervals. (I) Effect of inhibition in input integration. Control curves for 4 wpi and mature GCs (dotted lines, same as in H) are plotted for comparison (PTX curves: n = 3–17, 4 wpi and n = 11–34, mature GCs). (J) Input integration at 30 % strength. PTX enhanced integration in mature but not immature GCs (*, p < 0.01, Bonferroni’s test after two-way ANOVA). CTRL: control; scale bars, 50 µm.

Comment in

References

    1. van Praag H, et al. Functional neurogenesis in the adult hippocampus. Nature. 2002;415:1030. - PMC - PubMed
    1. Jessberger S, Kempermann G. Adult-born hippocampal neurons mature into activity-dependent responsiveness. Eur.J.Neurosci. 2003;18:2707. - PubMed
    1. Laplagne DA, et al. Functional convergence of neurons generated in the developing and adult hippocampus. PLoS.Biol. 2006;4:e409. - PMC - PubMed
    1. Lledo PM, Alonso M, Grubb MS. Adult neurogenesis and functional plasticity in neuronal circuits. Nat.Rev.Neurosci. 2006;7:179. - PubMed
    1. Ramirez-Amaya V, Marrone DF, Gage FH, Worley PF, Barnes CA. Integration of new neurons into functional neural networks. J.Neurosci. 2006;26:12237. - PMC - PubMed

Publication types

MeSH terms