. 2012 Jan 26;73(2):249-59.
doi: 10.1016/j.neuron.2011.11.016.

Photoactivatable neuropeptides for spatiotemporally precise delivery of opioids in neural tissue

Affiliations

Photoactivatable neuropeptides for spatiotemporally precise delivery of opioids in neural tissue

Matthew R Banghart et al. Neuron. .

Abstract

Neuropeptides activate G protein-coupled receptors to acutely modulate cellular excitability and synaptic transmission. However, due to the lack of reagents for precise delivery of peptides within dense brain tissue, the spatiotemporal scale over which neuropeptides act is unknown. To achieve rapid and spatially delimited delivery of neuropeptides in mammalian brain tissue, we developed photoactivatable analogs of two opioids: [Leu⁵]-enkephalin (LE) and the 8 amino acid form of Dynorphin A (Dyn-8). These peptides are functionally inactive prior to photolysis, and exposure to ultraviolet (UV) light causes clean release of LE and Dyn-8. Recordings from acute slices of rat locus coeruleus (LC) demonstrated that photorelease of LE activates mu opioid receptor-coupled K+ channels with kinetics that approach the limits imposed by G protein-mediated signaling. Temporally precise and spatially delimited photorelease revealed the kinetics and ionic nature of the mu opioid response and the mechanisms that determine the spatial profile of enkephalinergic volume transmission in LC.


Figures

Figure 1
Figure 1
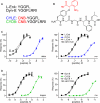
CYLE and CYD8 are caged LE and Dyn-8 analogues, respectively. (A) One-letter code amino acid sequences of LE, Dyn-8 and the CNB-modified analogues CYLE and CYD8. (B) Chemical structure of CYLE. The CNB moiety is drawn in red. (C) Dose-response curves for LE, CYLE and LE in 100 nM CYLE at delta (left) and mu (right) opioid receptors. The solid lines depict the best fit sigmoidal functions used to derive the EC50 values reported in the text. The dashed lines are fits to the data obtaining by adding caged compound to the parent peptide dilution series and demonstrate the lack of antagonist by the caged compound. Data were normalized to the maximal responses produced by the endogenous peptide agonists and are expressed as the mean ± SEM. (D) As in panel C showing the dose-response curves for Dyn-8, CYD8, and Dyn-8 in 100 nM CYD8 at kappa (left) and mu (right) opioid receptors.
Figure 2
Figure 2
Rapid activation of outward currents in neurons of LC in an acute brain slice by photorelease of LE. (A) left, Dodt contrast image of an acute horizontal brainstem slice that contains the LC. The 4th ventricle is marked (4V). right, magnified image of the boxed region in the left image. (B) Silencing of spontaneous action potentials in a LC neuron by local perfusion of LE. (C) left, outward currents in a LC neuron resulting from application of LE (black bar) and CYLE (gray bar). right, Average peak amplitudes of currents triggered by LE (black) and CYLE (gray) (n = 6 cells). Data are expressed as the mean ± SEM. * denotes a significant difference from local perfusion of 10 μM LE (p<0.05). (D) left, outward current in a LC neuron bathed in 10 μM CYLE evoked by a 5 ms flash of UV light in the absence (purple) or presence (blue) of the opioid antagonist Naloxone (Nal). The uncaging stimulus was applied at the time indicated by the arrowhead. right, Average peak amplitudes of UV-light evoked currents in each condition (n = 3 cells). * denotes a significant difference from photolysis in the absence of Naloxone (p<0.05). (E) Overlay of currents from a LC neuron in response to local application of LE (black) and to an uncaging stimulus (purple) in the presence of 10 μM CYLE. The local perfusion experiment was sampled at 0.5 Hz. Each data point represents the average current during a 1 s acquisition. (F) Average peak amplitudes (left), τon (middle) and τoff (right) of currents evoked by local application of 10 μM LE (black) or an uncaging stimulus in the presence of 10 μM CYLE (purple, n = 6 cells). * denotes a significant difference from local perfusion of 10 μM LE (p<0.05). (G) Individual, baseline normalized responses from 15 uncaging stimuli applied to the same cell, applied every 3 minutes. The time between episodes is omitted for clarity.
Figure 3
Figure 3
Graded activation of outward currents in LC neurons evoked by photorelease of LE. (A) left, Currents measured in a LC neuron to uncaging stimuli using a 30 μm spot of light focused on the soma at powers ranging from 1 (black) to 91 mW (red). right, Average peak amplitudes of currents evoked at different laser powers (n = 6 cells). Data are expressed as the mean ± SEM. (B) Reverse contrast two-photon laser scanning microscopy image of a LC neuron filled with Alexa Fluor-594. The colored rings and corresponding legend indicate the various diameters of a collimated photolysis beam. (C) Current (top) and voltage (bottom) responses of a LC neuron evoked by uncaging over the areas depicted in panel B. (D) Average peak current amplitude (left axis, squares) and action potential pause duration (right axis, circles) as a function of uncaging spot diameter. Circles are offset slightly to the right for clarity.
Figure 4
Figure 4
Activation of K+ currents by LE. (A) Voltage ramp protocol for measuring K+ currents. (B) Currents from a LC neuron in response to the voltage ramp protocol in the absence (black) and presence of an uncaging stimulus (purple). (C) Average isolated responses to the uncaging stimulus and voltage ramp in the absence (black, n = 12 cells) and presence of the GIRK blocker BaCl2 (blue, n = 13 cells). The dotted line indicates the baseline current in the absence of LE signaling. Average traces are shown as the mean (line) ± SEM (shaded regions). (D) Average current vs. voltage plot for the average currents shown in panel C indicate the reversal potential corresponds to the calculated reversal potential of K+. (E) Current vs. voltage plot for the currents generated by the indicated uncaging stimuli in an individual LC neuron.
Figure 5
Figure 5
Effect of peptidase inhibitors on light-evoked currents.. (A) Average (n = 5 cells) responses to the uncaging stimuli before (colors) and after (gray) addition of the peptidase inhibitors. The control condition traces are color-coded to indicate the uncaging beam area as in Figures 3B–D. Average traces are shown as the mean (line) ± SEM (shaded regions). (B) Peak amplitude (left), total charge transfer (middle), temporal moment (right) of the responses evoked by the uncaging stimuli for each cell in basal control conditions and after addition of peptidase inhibitors (PIs). The average population data are also shown (closed circles) as the mean ± SEM. * denotes a significant difference from control (p<0.05). The small currents generated in response to the two smallest uncaging stimuli did not allow reliable calculation of moments.
Figure 6
Figure 6
Spatial extent of LE signaling. (A) left, Currents in a LC neuron evoked by a focused 2 μm spot of UV light at various distances from the soma. right, Average peak amplitude (n = 9 cells) of evoked currents as a function of distance from the soma. Data are expressed as the mean ± SEM. (B) Rising phases of the average currents (left) and quantification of the time constants of activation (τon, right) (n = 9 cells) showing faster activation kinetics for stimuli delivered near the soma.

Similar articles

Cited by

References

    1. Adamantidis A, Carter MC, de Lecea L. Optogenetic deconstruction of sleep-wake circuitry in the brain. Front Mol Neurosci. 2010;2:31. - PMC - PubMed
    1. Alreja M, Aghajanian GK. Opiates suppress a resting sodium-dependent inward current and activate an outward potassium current in locus ceruleus neurons. J Neurosci. 1993;13:3525–3532. - PMC - PubMed
    1. Alreja M, Aghajanian GK. QX-314 blocks the potassium but not the sodium-dependent component of the opiate response in locus ceruleus neurons. Brain Res. 1994;639:320–324. - PubMed
    1. Beddell CR, Clark RB, Hardy GW, Lowe LA, Ubatuba FB, Vane JR, Wilkinson S. Structural requirements for opioid activity of analogues of the enkephalins. Proc R Soc Lond B Biol Sci. 1977;198:249–265. - PubMed
    1. Carter AG, Soler-Llavina GJ, Sabatini BL, Chalifoux JR, Carter AG. Timing and location of synaptic inputs determine modes of subthreshold integration in striatal medium spiny neurons. J Neurosci. 2007;27:8967–8977. - PMC - PubMed

Publication types