. 2012 Jan 26;73(2):360-73.
doi: 10.1016/j.neuron.2011.11.018.

Endocannabinoids shape accumbal encoding of cue-motivated behavior via CB1 receptor activation in the ventral tegmentum

Affiliations

Endocannabinoids shape accumbal encoding of cue-motivated behavior via CB1 receptor activation in the ventral tegmentum

Erik B Oleson et al. Neuron. .

Abstract

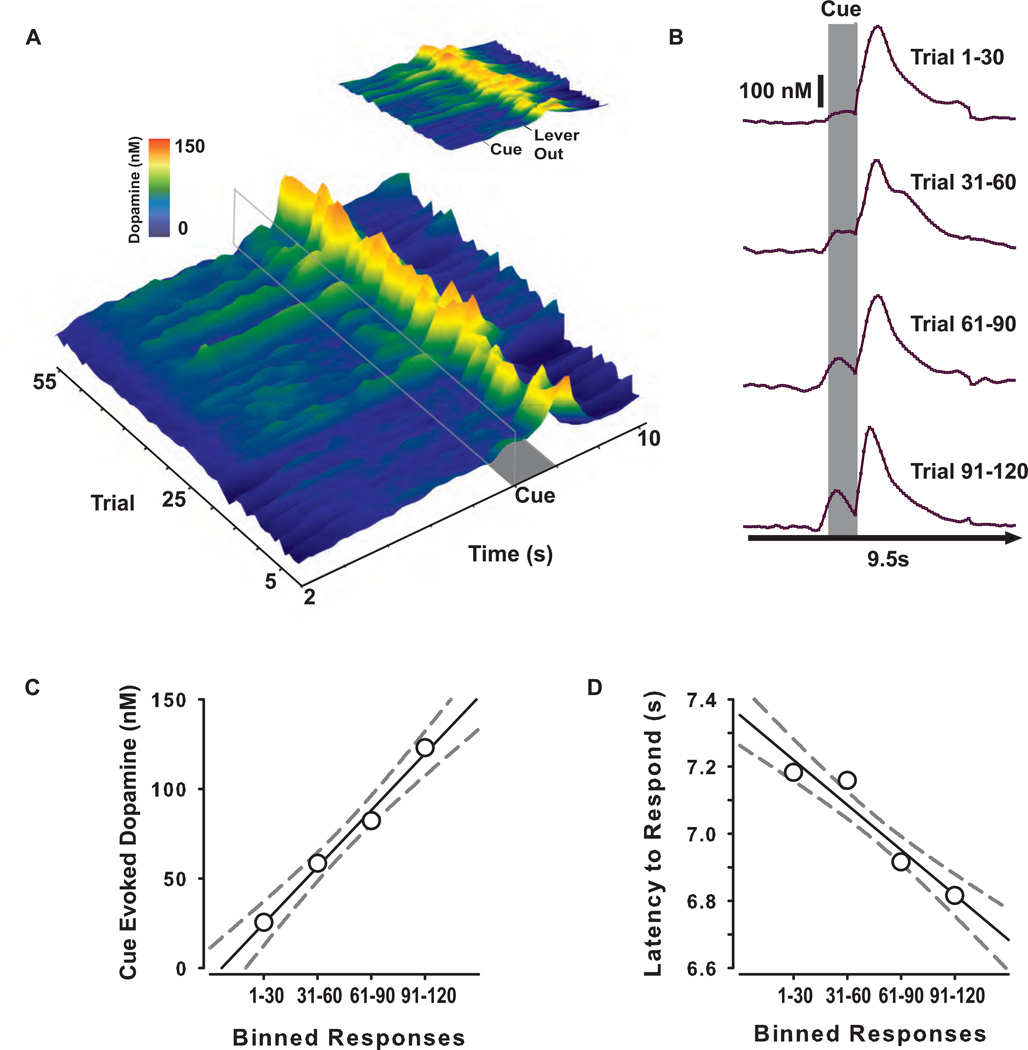
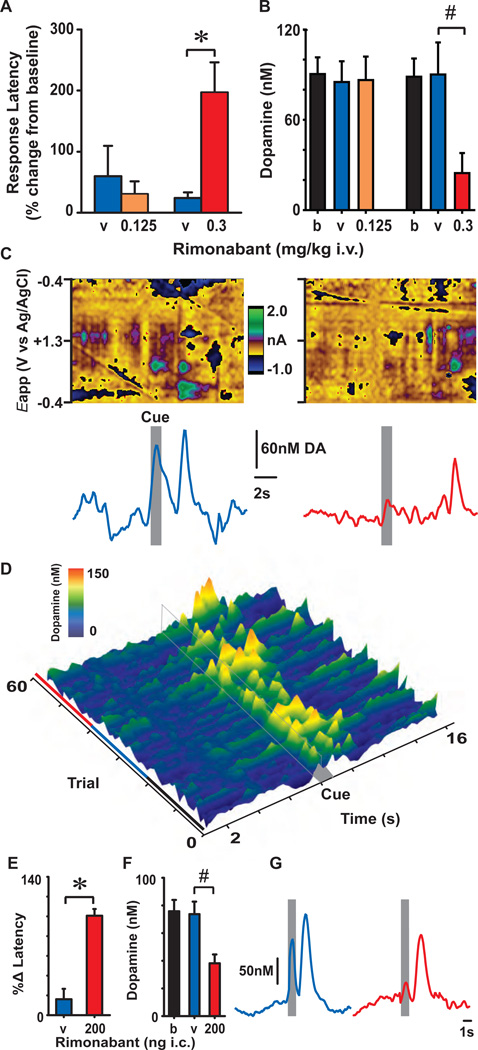
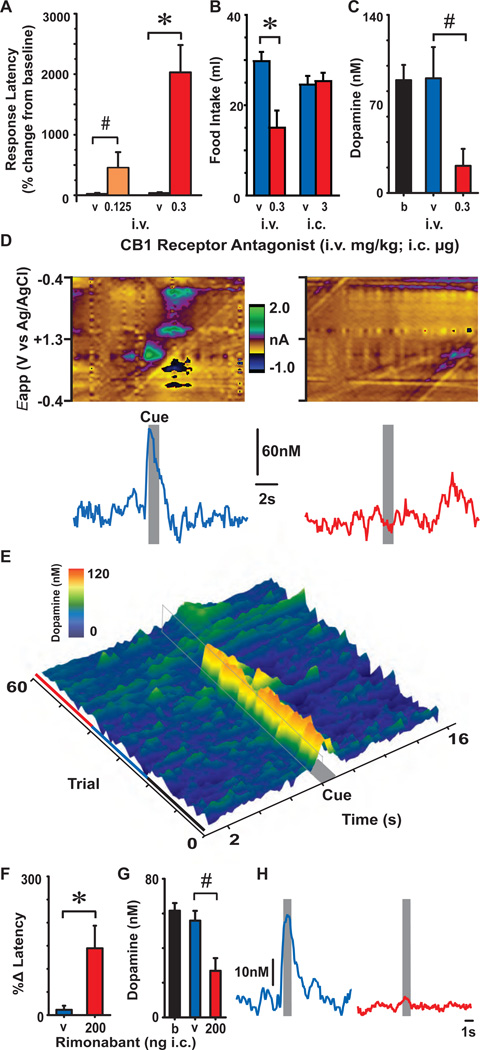
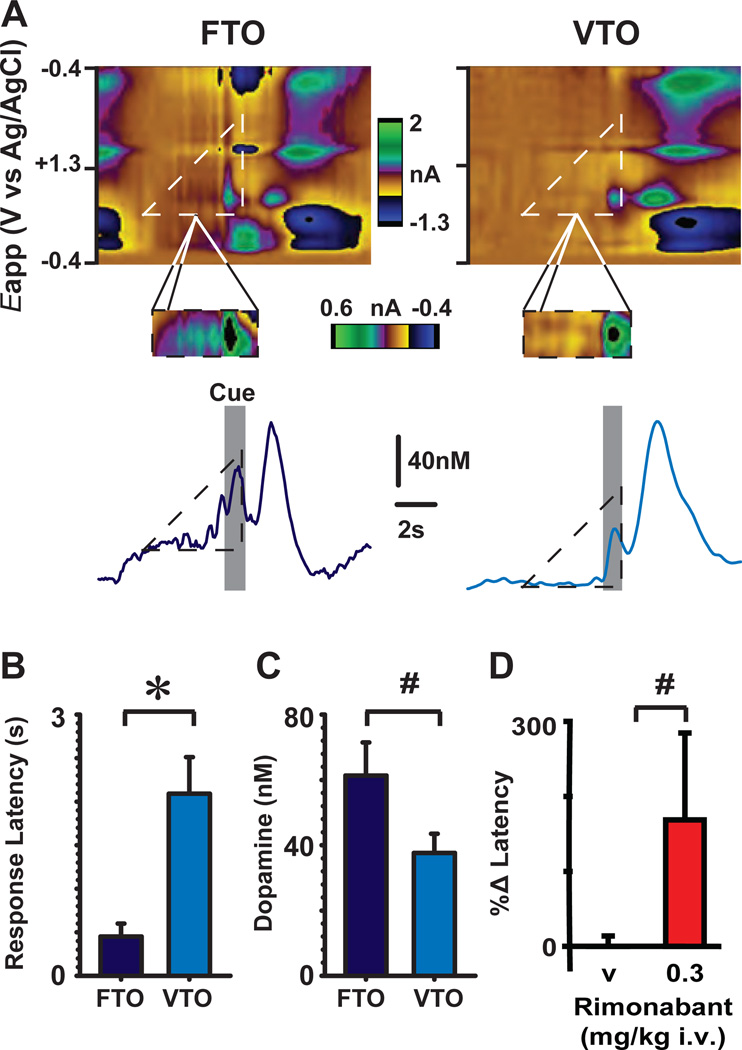
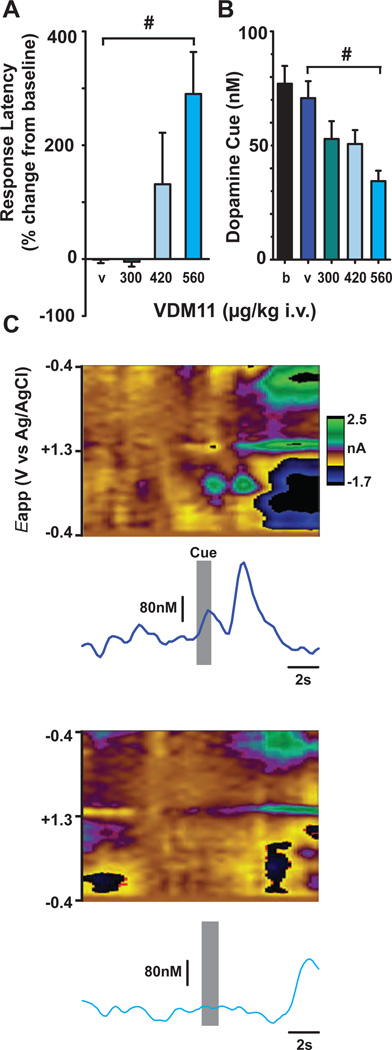
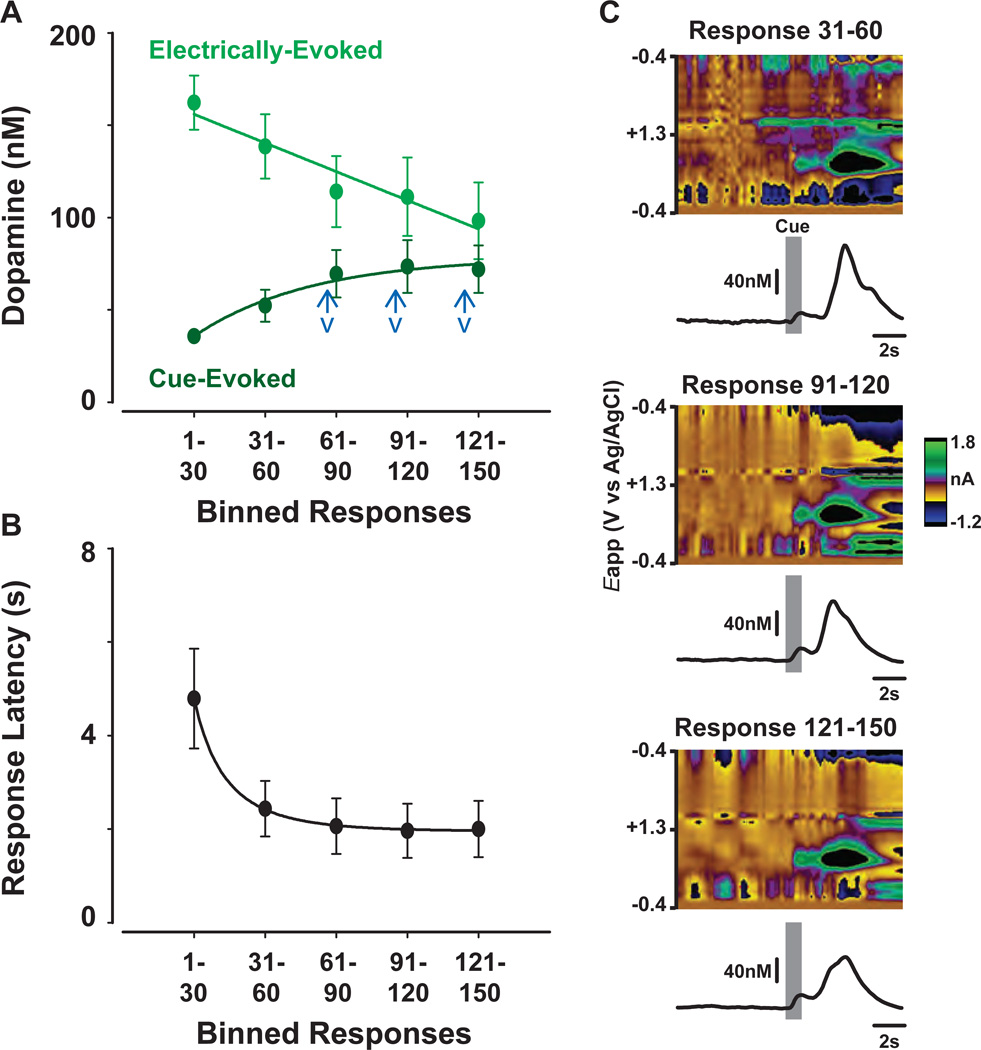
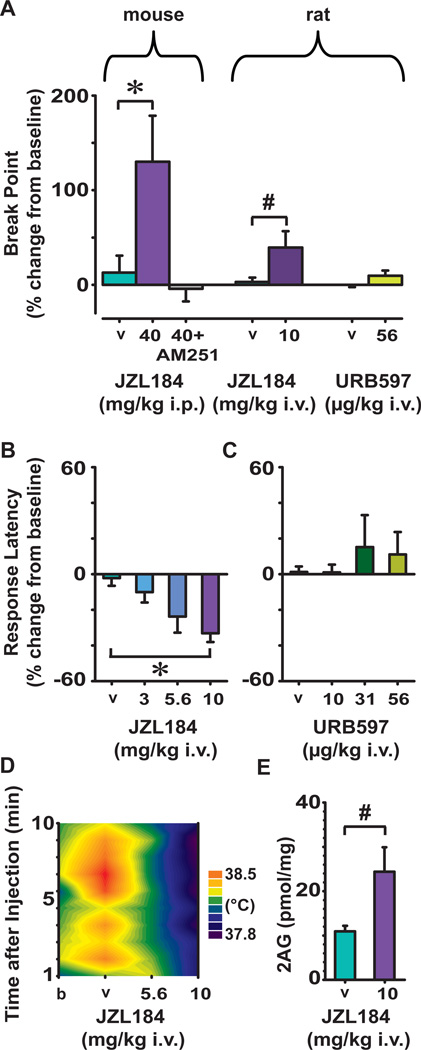
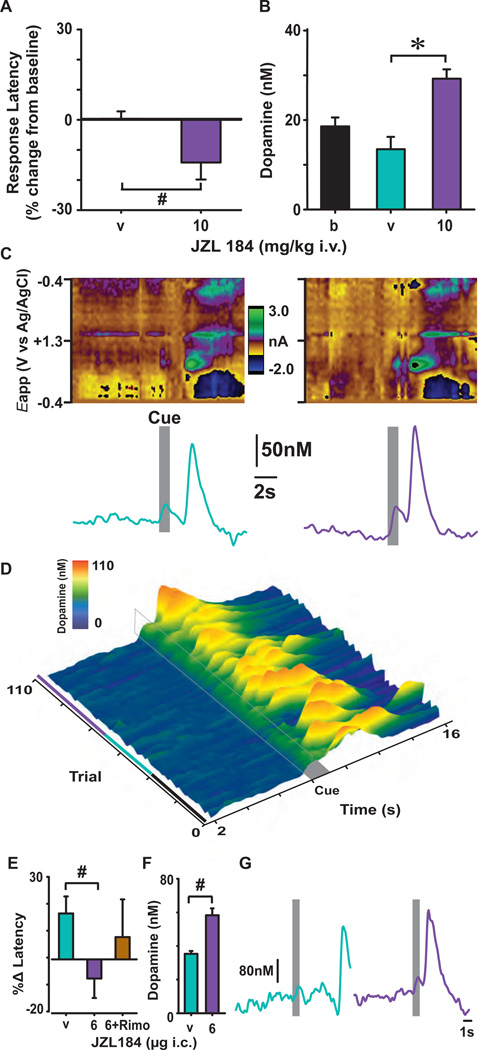
Transient increases in nucleus accumbens (NAc) dopamine concentration are observed when animals are presented with motivationally salient stimuli and are theorized to energize reward seeking. They arise from high-frequency firing of dopamine neurons in the ventral tegmental area (VTA), which also results in the release of endocannabinoids from dopamine cell bodies. In this context, endocannabinoids are thought to regulate reward seeking by modulating dopamine signaling, although a direct link has never been demonstrated. To test this, we pharmacologically manipulated endocannabinoid neurotransmission in the VTA while measuring transient changes in dopamine concentration in the NAc during reward seeking. Disrupting endocannabinoid signaling dramatically reduced, whereas augmenting levels of the endocannabinoid 2-arachidonoylglycerol (2AG) increased, cue-evoked dopamine concentrations and reward seeking. These data suggest that 2AG in the VTA regulates reward seeking by sculpting ethologically relevant patterns of dopamine release during reward-directed behavior.


Figures

Figure 1
Figure 1. Reward seeking and cue-evoked dopamine release events are strengthened across trials
(A) Pavlovian associations sculpt patterns of transient dopamine release in response to a predictive cue during reward seeking. A representative surface-plot shows changes in dopamine concentration (z-axis) occurring across trials (y-axis) while responding is maintained by brain stimulation reward in an ICSS task. Cue presentation, which is indicated by the gray rectangle, occurred for 1-s prior to lever extension. (B) Representative traces show the mean cue-evoked dopamine concentration increasing across trials. Each dopamine concentration trace represents the mean of 30 consecutive trials. (C,D) The conditioned cue begins to strengthen reward seeking as the concentration of cue-evoked dopamine increases across trials. Linear regression analyses show increases in mean dopamine concentration and decreases in response latency across binned responses. Dashed lines represent the 95% confidence region.
Figure 2
Figure 2. Disrupting endocannabinoid signaling decreases cue-evoked dopamine concentrations during reward seeking in an ICSS task
(A) Response latency (a metric of reward seeking) for brain stimulation reward maintained in the ICSS task. A high (0.3 mg/kg i.v.; red bar) but not low (0.125 mg/kg i.v.; orange bar) dose of rimonabant increased the latency to respond for brain stimulation reward in comparison to vehicle (v, blue bar). (B) Mean dopamine concentration observed during the first second of cue presentation under baseline (b), vehicle (v) and drug conditions. Rimonabant at a high (0.3 mg/kg i.v.; red bar) but not low (0.125 mg/kg i.v.; orange bar) dose decreased the concentration of cue-evoked dopamine in comparison to vehicle. (C) Representative color plots (top) and dopamine concentration traces (bottom) show the effects of rimonabant on cue-evoked dopamine events in individual trials. Top: Representative color plots topographically depict the voltammetric data with time on the x-axis, applied scan potential (Eapp) on the y-axis and background-subtracted faradic current shown on the z-axis in pseudo-color. Dopamine can be identified by an oxidation peak (green) at +0.6 V and a smaller reduction peak (yellow) at −0.2 V. Bottom: Corresponding traces show the concentration of dopamine (nM) detected at the time of cue presentation (gray bar) following vehicle (left; blue trace) and rimonabant (right; red trace) administration. (D) A representative surface-plot shows changes in dopamine concentration (z-axis) across trials (y-axis) during baseline (black line), vehicle (blue line) and rimonabant (red line) conditions. Data are centered around lever presentation on the x-axis. (E) Disrupting endocannabinoid signaling within the VTA is sufficient to decrease reward seeking. Intrategmental rimonabant (200 ng i.c.; red bar) significantly increased response latency in comparison to vehicle (v, blue bar). (F) Mean dopamine concentrations observed during first second of cue-presentation under baseline (b), vehicle (v) and drug conditions. Intrategmental rimonabant (200 ng i.c.; red bar) significantly decreased the concentration of cue-evoked dopamine in comparison to vehicle. (G) Representative dopamine concentration traces from individual trials after vehicle (left; blue trace) and rimonabant (200 ng i.c.; right; red trace) treatment. Traces represent individual data, bars represent mean values, and error bars represent ±SEM. A significant difference versus vehicle is indicated by either * (p<0.01) or # (p<0.05).
Figure 3
Figure 3. Disrupting endocannabinoid signaling decreases cue-evoked dopamine neurotransmission during appetitive food seeking
(A) Disrupting endocannabinoid signaling reduced reward seeking in a cued food self-administration task. Rimonabant dose-dependently (0.125 mg/kg i.v., orange bar; 0.3 mg/kg i.v., red bar) increased the latency to respond for food reinforcement in comparison to vehicle (v, blue bar). (B) Disrupting endocannabinoid transmission in the VTA specifically decreased appetitive rather than consummatory feeding behavior. Systemically (left, red bar), but not intrategmentally (right, red bar) administered CB1 receptor antagonists decreased intra-oral intake of a chocolate Ensure solution in comparison to vehicle (v, blue bar), demonstrating that the VTA endocannabinoid system does not affect an animal’s preferred meal size. (C) Diminished appetitive food seeking is accompanied by a decrease in mean dopamine concentration observed during the first second of cue-presentation following rimonabant (0.3 mg/kg i.v., red bar) treatment. (D) Representative color plots (top) and dopamine concentration traces (bottom) show the effects of rimonabant (right, red trace) in comparison to vehicle (left, blue trace) during individual trials. (E) A representative surface plot illustrates changes in dopamine concentration across trials (y-axis) under baseline (black line), vehicle (blue line) and rimonabant (red line) conditions. (F) Disrupting endocannabinoid neurotransmission in the VTA is sufficient to decrease appetitive food seeking. Intrategmental rimonabant (200 ng i.c.; red bar) significantly increased response latency in comparison to vehicle (v, blue bar). (G) Rimonabant (200 ng i.c.; red bar) simultaneously decreased the mean cue-evoked dopamine concentration in comparison to vehicle treatment. (H) Representative traces illustrate that intrategmental rimonabant (200ng i.c., right, red trace) decreased the concentration of cue-evoked dopamine in an individual trial in comparison to vehicle treatment (left, blue trace). Traces represent individual data, bars represent mean values, and error bars represent ±SEM. A significant difference versus vehicle is indicated by either * (p<0.01) or # (p<0.05).
Figure 4
Figure 4. Disrupting endocannabinoid signaling decreases reward seeking under experimental conditions that do not recruit neural mechanisms of interval timing
(A) Transient dopamine concentrations increase during the anticipation of reward under conditions in which cue-presentation is predictable (e.g., Fixed time-out (FTO)=10s)) but not under conditions in which cue-presentations occurs variably (variable-time outs (VTO), x̄ =30s)). Representative mean (average of 30 trials/condition) color plots (top) and corresponding dopamine concentration traces (bottom) illustrate changes in dopamine concentration occurring prior to cue presentation from the same animal responding for brain stimulation reward under FTO (left) then VTO (right) conditions. Middle inset shows a magnification of the color plots showing dopamine concentration increases occurring prior to cue presentation. (B) The mean latency to respond for brain stimulation reward was significantly greater under VTO (light blue bar) in comparison to FTO (dark blue bar) conditions. (C) The mean dopamine concentration occurring during the first second of cue-presentation was significantly decreased under VTO in comparison the FTO conditions. (D) Under VTO conditions, rimonabant (0.3 mg/kg i.v., red bar) significantly increased the latency to respond for brain stimulation reward in comparison to vehicle (v, blue bar). Traces and bars represent mean values while error bars represent ±SEM. A significant difference versus vehicle is indicated by either * (p<0.01) or # (p<0.05).
Figure 5
Figure 5. The putative endocannabinoid uptake inhibitor VDM11 decreases dopamine mechanisms of reward seeking in a manner that is consistent with indirect CB1 receptor antagonism
(A) VDM11 dose-dependently (300–560 µg/kg i.v., cumulative) increased the latency to respond for brain stimulation reward in the ICSS-VTO task in comparison to vehicle (v). (B) Dopamine concentration observed during the first second of cue-presentation in the ICSS-VTO task under baseline (b), vehicle (v) or drug (VDM11 300–560 µg/kg i.v., cumulative) conditions. VDM11 dose-dependently decreased the mean concentration of cue-evoked dopamine. (C) Representative color plots (top) and dopamine concentration traces (bottom) show the effects of VDM11 (560 µg/kg i.v., right, light blue line) and vehicle (left, dark blue line) during individual trials of the ICSS-VTO task. Dopamine traces represent individual data, bars represent mean values and error bars represent ±SEM. A significant difference versus vehicle is indicated by # (p<0.05).
Figure 6
Figure 6. Electrically-evoked, but not cue-evoked, dopamine concentrations are partially depleted during ICSS sessions
(A) Electrically- (light green) and cue- (dark green) evoked dopamine concentrations across binned responses. Animals are responding for brain stimulation reward in the ICSS-VTO task during repeated vehicle (1:1:18, v, blue arrow) treatments. Under these conditions, cue-evoked dopamine concentrations initially increased to maximum and then remained stable throughout the duration of the session. Conversely, electrically-evoked dopamine concentrations decreased linearly across the duration of the session. (B) Corresponding response latency values. The latency to respond for brain stimulation reward initially decreased to minimum and then remained stable throughout the duration of the session. (C) Representative mean color plots (top) and corresponding dopamine concentration traces (bottom) illustrate changes in dopamine concentration occurring across binned responses. Nonlinear regression functions show best-fit data trends, Data points and dopamine traces represent mean data, and error bars represent ±SEM.
Figure 7
Figure 7. The endocannabinoid 2AG, but not anandamide, facilitates reward seeking
(A) The effects of JZL184 (decreases degradation of 2AG) or URB597 (decreases degradation of anandamide) on break points for food reinforcement maintained under a progressive ratio schedule. Left: In mice, JZL184 (40 mg/kg i.p., purple bar) increased break points for food reinforcement in comparison to vehicle (v, green bar). Pretreatment with a subthreshold dose of AM251 (0.75 mg/kg i.p.) prevented the JZL184-induced increase in break point. Middle: In rats, JZL184 (10 mg/kg i.v.) produced a significant increase in mean final ratio when compared to vehicle. Right: In rats, URB597 (56 µg/kg i.v., yellow bar) failed to increase the break points for food. (B,C) JZL184 (3–10 mg/kg i.v. cumulative) but not URB597 (10–56 µg/kg i.v., cumulative) decreased response latency for brain stimulation reward in the ICSS-VTO task in rats. (D) Topographic plot showing core temperature of rats (z-axis) over time (y-axis) under baseline (b), vehicle (v), and JZL184 (5.6 then 10 mg/kg i.v. cumulative) conditions. (E) JZL184 (10mg/kg i.v., purple bar) treated rats showed a significant increase in 2AG VTA tissue content in comparison to vehicle treated rats. Tissue samples were collected immediately after ICSS-VTO sessions. Bars represent mean ±SEM values. A significant difference versus vehicle is indicated by either * (p<0.01) or # (p<0.05).
Figure 8
Figure 8. The endocannabinoid 2AG facilitates dopaminergic mechanisms of reward seeking
(A) Augmenting 2AG levels facilitated reward seeking in the ICSS-VTO task. JZL184 (10 mg/kg i.v., purple bar) decreased response latency in comparison to vehicle (v, blue bar). (B) Facilitated reward seeking was accompanied by an increase in cue-evoked dopamine concentration. (C) Representative color plots (top) and dopamine concentration traces (bottom) show the effects of JZL184 (right, purple trace) in comparison to vehicle (left, green trace) during individual trials. (D) A representative surface plot illustrates changes in dopamine concentration across trials (y-axis) under baseline (black line), vehicle (green line) and rimonabant (purple line) conditions. (E) Augmenting 2AG in the VTA is sufficient to facilitate reward seeking. JZL184 (6µg, ipsilateral, purple bar) decreased response latency in comparison to DMSO (green bar). Post-treatment with a subthreshold dose of rimonabant (1.25 mg/kg i.v.) reversed the JZL84-induced decrease in reward latency. (F) Facilitated reward seeking occurred simultaneously with an increase in cue-evoked dopamine concentration in comparison to vehicle. (G) Representative traces show the effects of intrategmental vehicle (left, green trace) and JZL184 (right, purple trace) on cue-evoked dopamine concentration in individual trials. Traces represent individual data, bars represent mean values, and error bars represent ±SEM. A significant difference versus vehicle is indicated by either * (p<0.01) or # (p<0.05).

References

    1. Alvarez-Jaimes L, Polis I, Parsons LH. Attenuation of cue-induced heroin-seeking behavior by cannabinoid CB1 antagonist infusions into the nucleus accumbens core and prefrontal cortex, but not basolateral amygdala. Neuropsychopharmacology. 2008;33:2483–2493. - PubMed
    1. Berridge KC, Robinson TE. What is the role of dopamine in reward: hedonic impact, reward learning, or incentive salience? Brain Res Brain Res Rev. 1998;28:309–369. - PubMed
    1. Bindra D. Neuropsychological Interpretation of the Effects of Drive and Incentive-Motivation on General and Instrumental Behavior. Psychological Review. 1968;75:1–22.
    1. Brady AM, O'Donnell P. Dopaminergic modulation of prefrontal cortical input to nucleus accumbens neurons in vivo. J Neurosci. 2004;24:1040–1049. - PMC - PubMed
    1. Bromberg-Martin ES, Hikosaka O. Lateral habenula neurons signal errors in the prediction of reward information. Nat Neurosci. 2011;14:1209–1216. - PMC - PubMed

Publication types

LinkOut - more resources