

Longitudinal progression trajectory of GFR among patients with CKD
- PMID: 22284441
- PMCID: PMC3312980
- DOI: 10.1053/j.ajkd.2011.12.009
Longitudinal progression trajectory of GFR among patients with CKD
Abstract
Background: The traditional paradigm of glomerular filtration rate (GFR) progression in patients with chronic kidney disease (CKD) is a steady nearly linear decline over time. We describe individual GFR progression trajectories over 12 years of follow-up in participants in the African American Study of Kidney Disease and Hypertension (AASK).
Study design: Longitudinal observational study.
Setting & participants: 846 AASK patients with at least 3 years of follow-up and 8 GFR estimates.
Measurements: Longitudinal GFR estimates from creatinine-based equations.
Predictors: Patient demographic and clinical features.
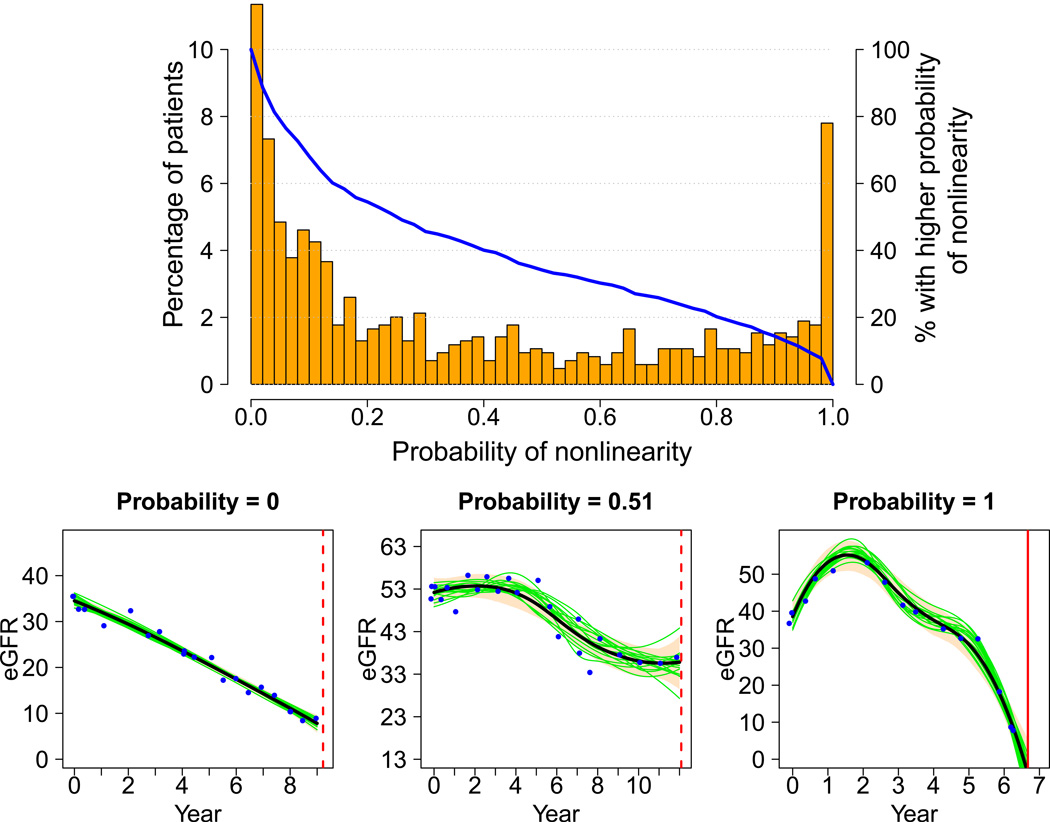
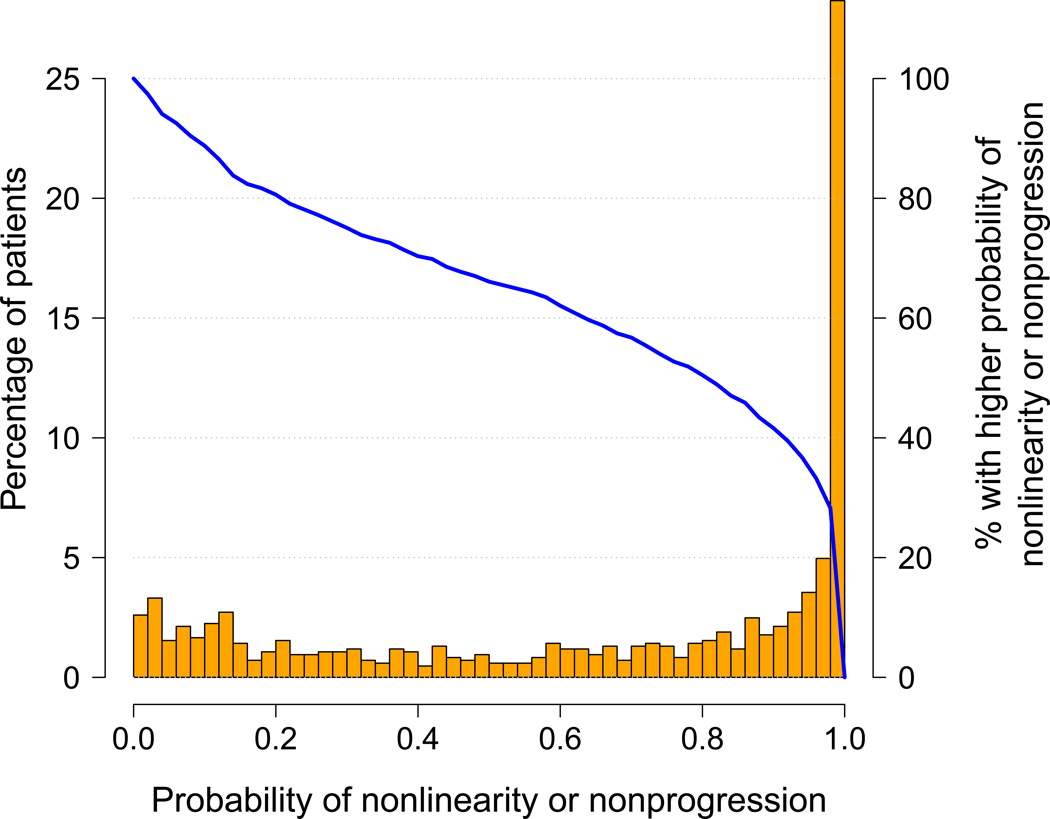
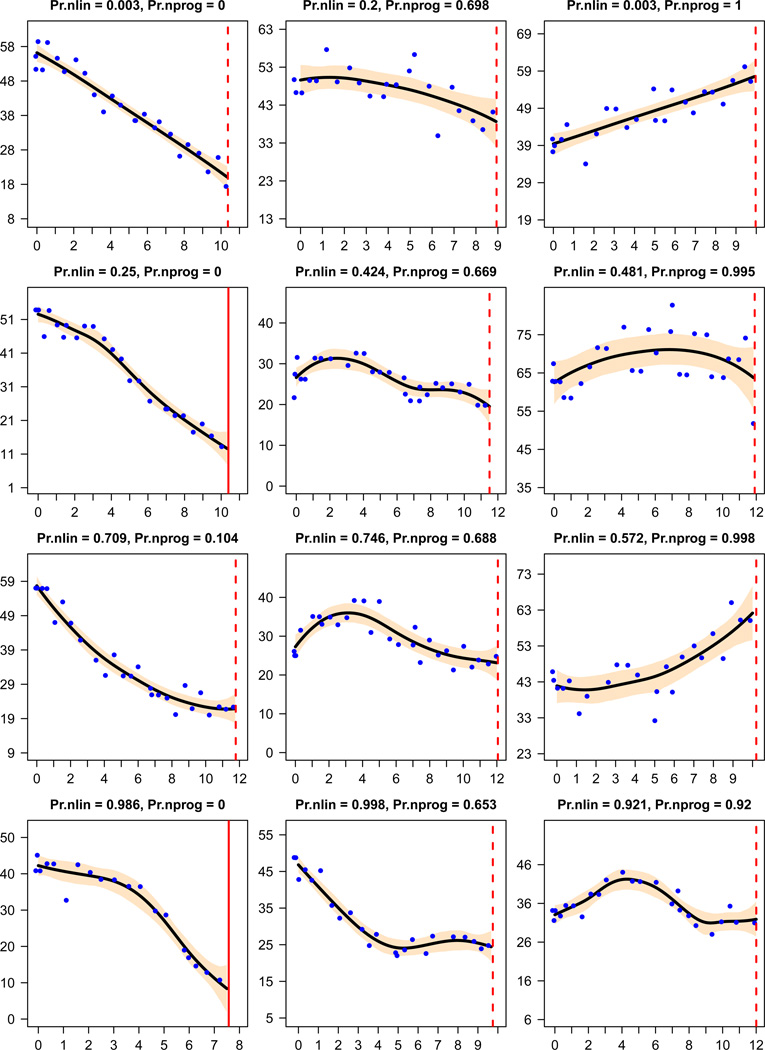
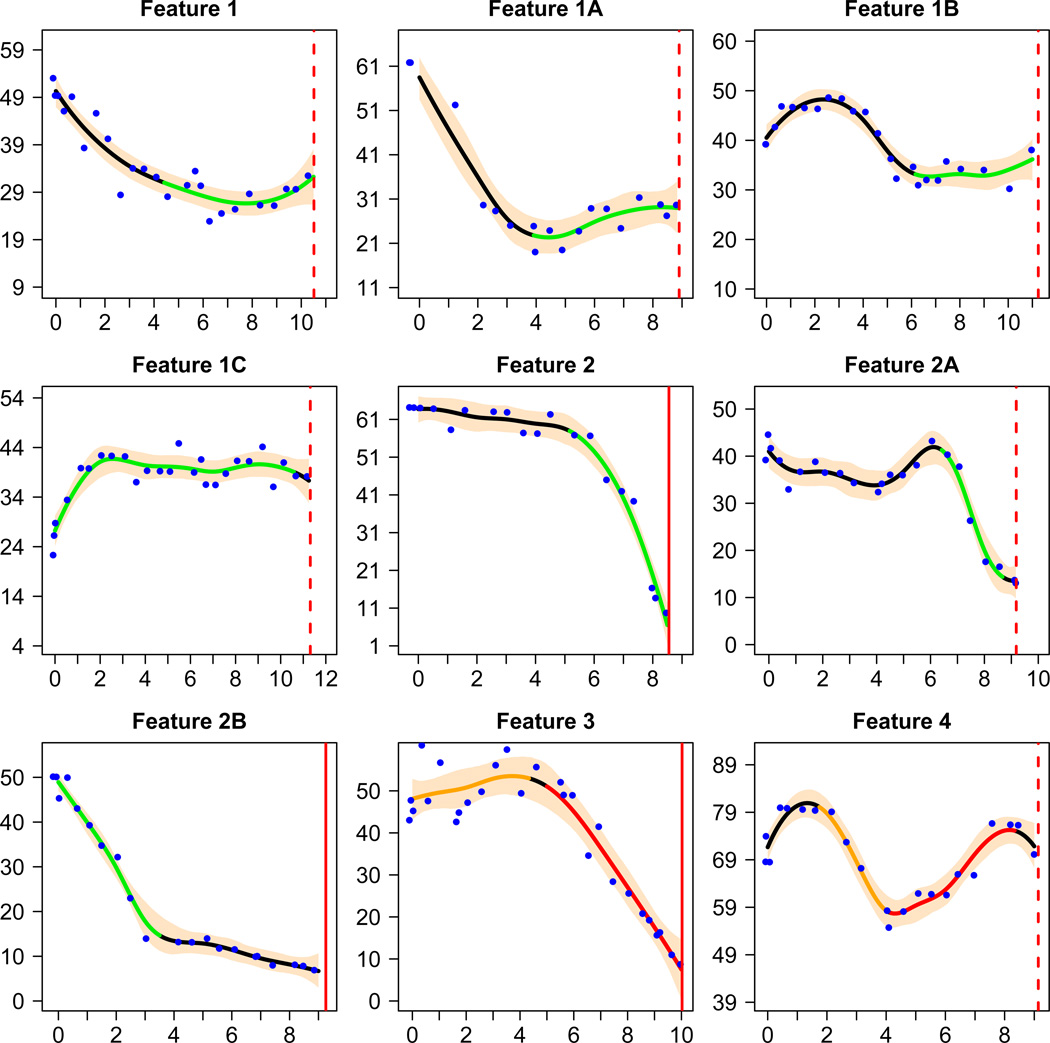
Outcomes: Probability of a nonlinear trajectory and probability of a period of nonprogression calculated for each patient from a Bayesian model of individual estimated GFR (eGFR) trajectories.
Results: 352 (41.6%) patients showed a > 0.9 probability of having either a nonlinear trajectory or a prolonged nonprogression period; in 559 (66.1%), the probability was > 0.5. Baseline eGFR > 40 mL/min/1.73 m2 and urine protein-creatinine ratio < 0.22 g/g were associated with a higher likelihood of a nonprogression period. 74 patients (8.7%) had both a substantial period of stable or increasing eGFR and a substantial period of rapid eGFR decrease.
Limitations: Clinical trial population; absence of direct GFR measurements.
Conclusions: In contrast to the traditional paradigm of steady GFR progression over time, many patients with CKD have a nonlinear GFR trajectory or a prolonged period of nonprogression. These findings highlight the possibility that stable kidney disease progression can accelerate and, conversely, provide hope that CKD need not be relentlessly progressive. These results should encourage researchers to identify time-dependent factors associated with periods of nonprogression and other desirable trajectories.
Copyright © 2012 National Kidney Foundation, Inc. Published by Elsevier Inc. All rights reserved.
Figures

Comment in
-
On being better kidney doctors: understanding trajectories, probabilities, predictability, and people.Am J Kidney Dis. 2012 Apr;59(4):475-7. doi: 10.1053/j.ajkd.2012.01.008. Am J Kidney Dis. 2012. PMID: 22444489 No abstract available.
References
-
- Mitch W, Walser M, Buffington G, Lemann J. A simple method of estimating progression of chronic renal failure. Lancet. 1976;2(7999):1326–1328. - PubMed
-
- Levey A, Perrone R, Madias N. Serum Creatinine and Renal Function. Annual Review of Medicine. 1988;39:465–490. - PubMed
-
- Hunsicker LG, Adler S, Caggiula A, et al. Predictors of the progression of renal disease in the Modification of Diet in Renal Disease Study. Kidney Int. 1997;51(6):1908–1919. - PubMed
-
- Klahr S, Levey AS, Beck GJ, et al. The effects of dietary protein restriction and blood-pressure control on the progression of chronic renal disease. N Engl J Med. 1994;330(13):877–884. - PubMed
-
- Lewis EJ, Hunsicker LG, Clarke WR, et al. Renoprotective effect of the angiotensin-receptor antagonist irbesartan in patients with nephropathy due to type 2 diabetes. N Engl J Med. 2001;345(12):851–860. - PubMed
Publication types
MeSH terms
Substances
Grants and funding
LinkOut - more resources
Full Text Sources
Other Literature Sources
Medical
Research Materials
Miscellaneous
