. 2012 Mar 15;259(3):329-37.
doi: 10.1016/j.taap.2012.01.010. Epub 2012 Jan 21.

Sodium fluoride induces apoptosis in mouse embryonic stem cells through ROS-dependent and caspase- and JNK-mediated pathways

Affiliations

Sodium fluoride induces apoptosis in mouse embryonic stem cells through ROS-dependent and caspase- and JNK-mediated pathways

Tam Dan Nguyen Ngoc et al. Toxicol Appl Pharmacol. .

Abstract

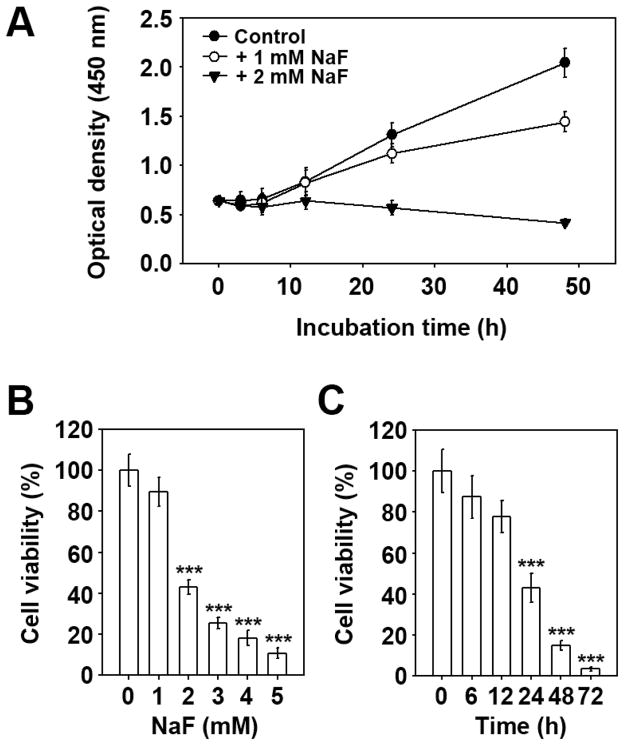
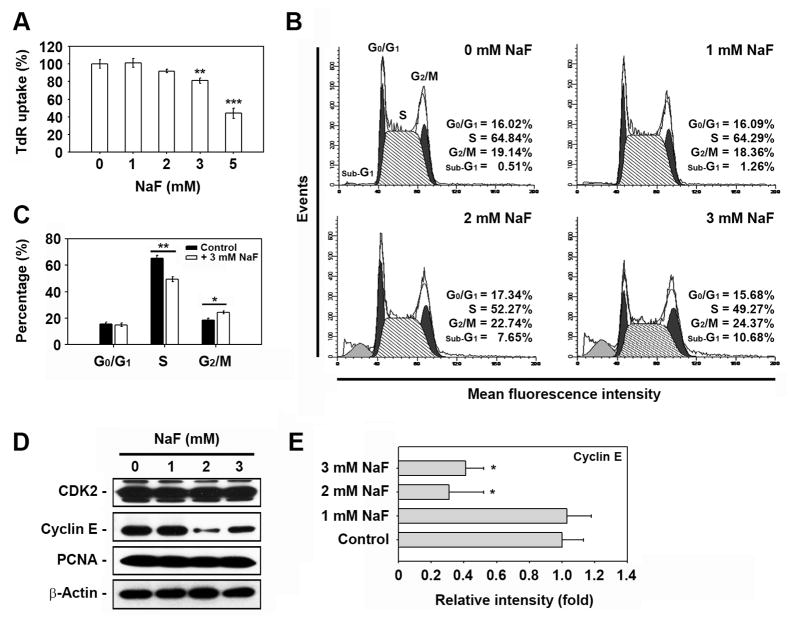
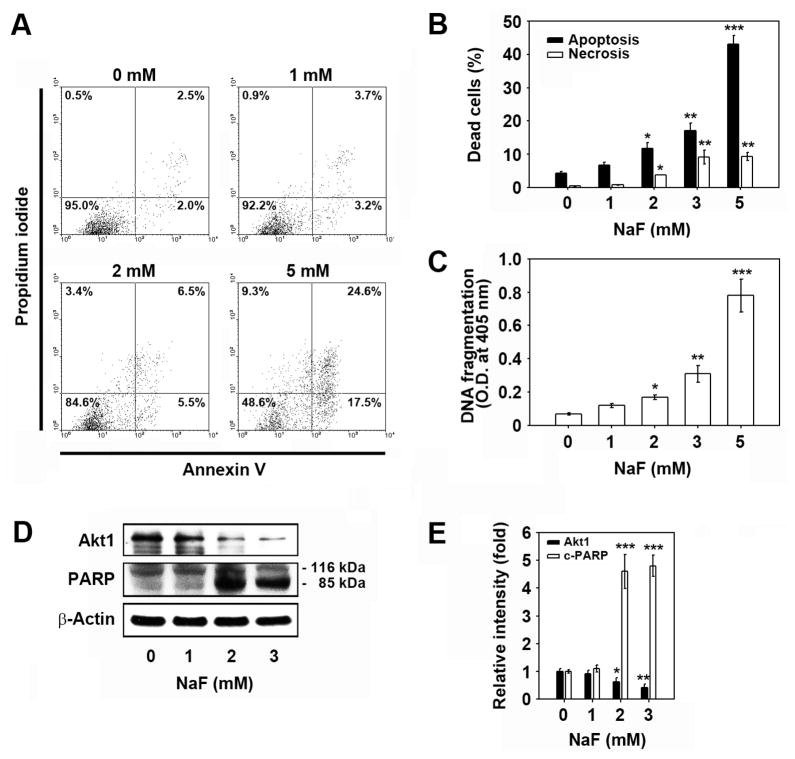
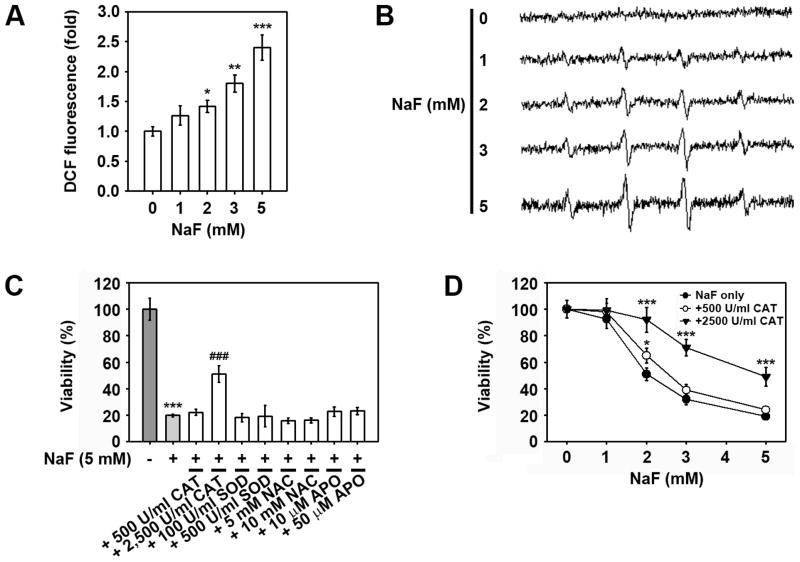
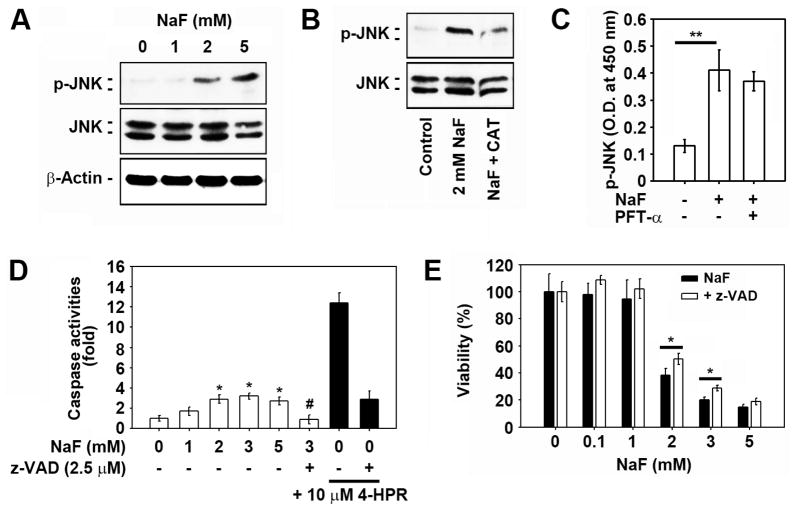
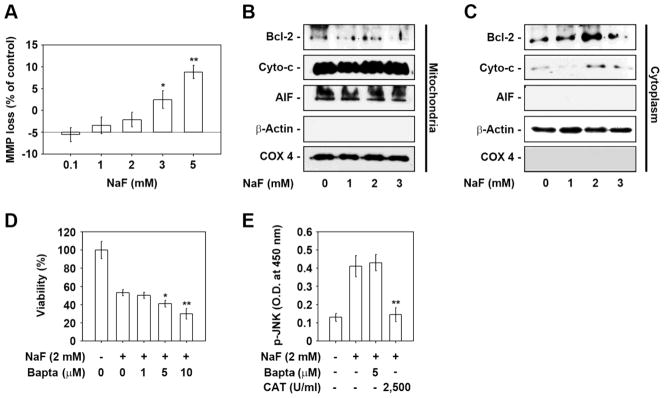
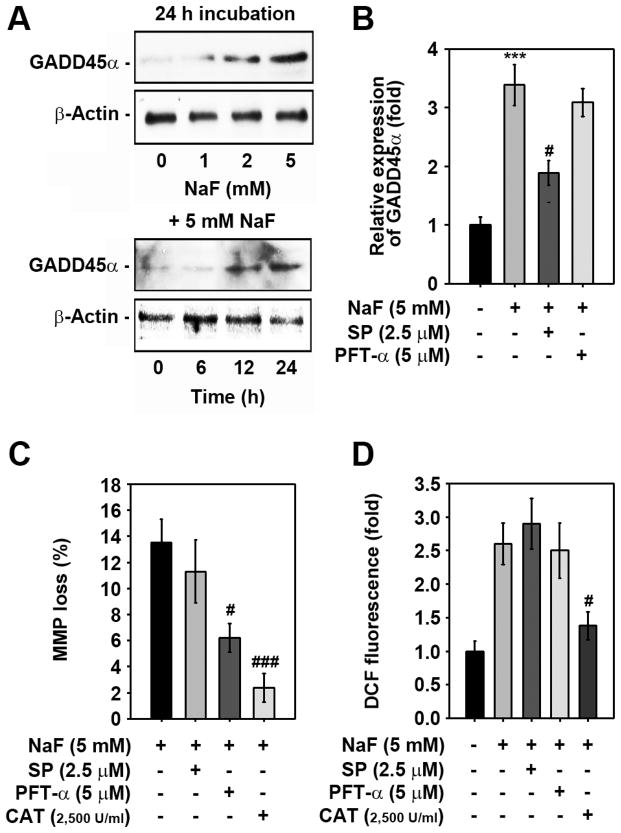
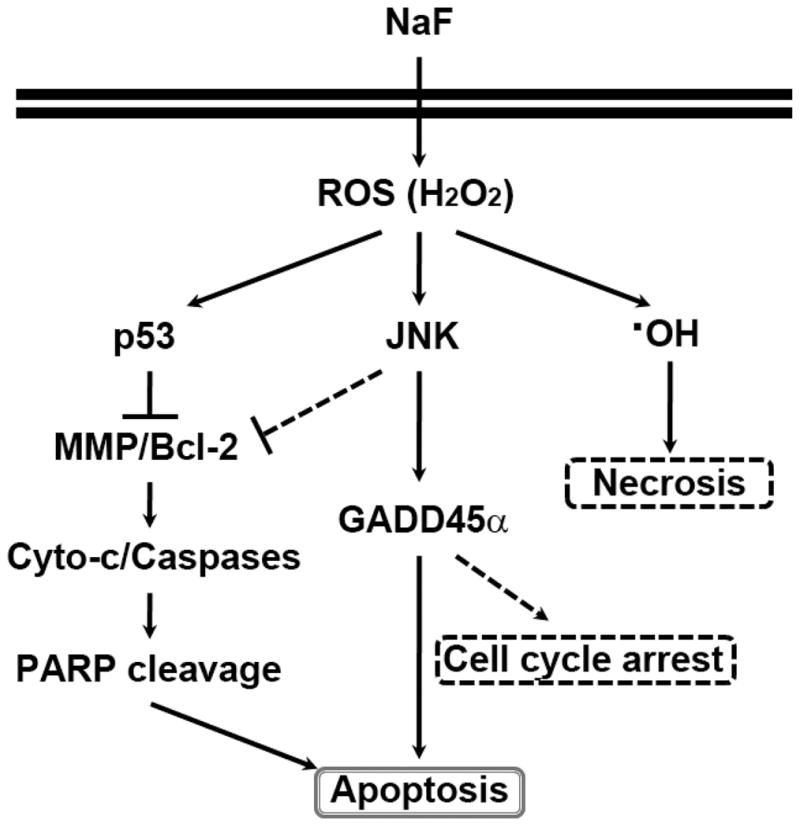
Sodium fluoride (NaF) is used as a source of fluoride ions in diverse applications. Fluoride salt is an effective prophylactic for dental caries and is an essential element required for bone health. However, fluoride is known to cause cytotoxicity in a concentration-dependent manner. Further, no information is available on the effects of NaF on mouse embryonic stem cells (mESCs). We investigated the mode of cell death induced by NaF and the mechanisms involved. NaF treatment greater than 1mM reduced viability and DNA synthesis in mESCs and induced cell cycle arrest in the G(2)/M phase. The addition of NaF induced cell death mainly by apoptosis rather than necrosis. Catalase (CAT) treatment significantly inhibited the NaF-mediated cell death and also suppressed the NaF-mediated increase in phospho-c-Jun N-terminal kinase (p-JNK) levels. Pre-treatment with SP600125 or z-VAD-fmk significantly attenuated the NaF-mediated reduction in cell viability. In contrast, intracellular free calcium chelator, but not of sodium or calcium ion channel blockers, facilitated NaF-induced toxicity in the cells. A JNK specific inhibitor (SP600125) prevented the NaF-induced increase in growth arrest and the DNA damage-inducible protein 45α. Further, NaF-mediated loss of mitochondrial membrane potential was apparently inhibited by pifithrin-α or CAT inhibitor. These findings suggest that NaF affects viability of mESCs in a concentration-dependent manner, where more than 1mM NaF causes apoptosis through hydroxyl radical-dependent and caspase- and JNK-mediated pathways.


Conflict of interest statement

Conflict of interest

The authors declare that there is no conflict of interest.

Figures

Fig. 1
Fig. 1. NaF reduces the viability of mESCs in a dose- and time-dependent manner
(A) Cells were incubated in the presence and absence of 1 or 2 mM NaF and at various incubation times. Viability was determined by the WST-8 assay. In addition, mESCs were treated with the increasing concentrations (0–5 mM) of NaF for 24 h (B) or with 2 mM for various incubation times (0–72 h) (C) and then processed for the WST-8 assay. ***p < 0.001 vs. the untreated controls.
Fig. 2
Fig. 2. NaF inhibits DNA synthesis and induces cell cycle arrest in the G2/M phase in mESCs
(A) Cells were exposed to various concentrations (0–5 mM) of NaF for 24 h and then processed for the tritium incorporation assay. (B) Cells were incubated in the presence of NaF (0–3 mM). After 24 h incubation, cell cycle progression was analyzed by flow cytometery after PI staining. (C) The results represent the mean ± S.D. from three independent experiments. (D) mESCs were incubated at the indicated doses of NaF for 24 h and processed for western blot analysis. In panel E, the cyclin E level was calculated from triplicate experiments after normalizing the bands to β-actin. *p < 0.04, **p < 0.01, and ***p < 0.001 vs. the untreated controls.
Fig. 3
Fig. 3. NaF induces cell death of mESCs mainly by apoptosis
(A) Cells were exposed to increasing concentrations (0–5 mM) of NaF for 24 h and assessed using flow cytometry with FITC-annexin V/PI double staining. In panel B, filled and open bars represent the early and late apoptotic cells and necrotic cells, respectively (n = 5), after calculation using the WinMDI 2.9 program. (C) ELISA assay of DNA fragmentation, or (D) western blot analysis was performed as described in the Materials and Methods. In panel E, the results represent the relative fold intensity of Akt1 and cleaved-PARP after normalizing the bands to β-actin (n = 5). *p < 0.05, **p < 0.01, and ***p < 0.001 vs. untreated control values.
Fig. 4
Fig. 4. Intracellular ROS is not directly related to NaF-induced reduction of mESC viability
Cells were exposed to increasing concentrations of NaF (0–5 mM) for 24 h and then processed for flow cytometric analysis after (A) DCFH-DA staining and (B) ESR measurements. (C) Cells were incubated with 5 mM NaF in the presence and absence of various antioxidants for 24 h and then processed for the WST-8 assay. (D) Cells were incubated in the presence of NaF (0–5 mM) with and without 500 U/ml CAT or 2,500 U/ml CAT 24 h before determination of viability. *p < 0.05, **p < 0.01, and ***p < 0.001 vs. the untreated controls. ###p < 0.001 vs. 5 mM NaF treatment alone.
Fig. 5
Fig. 5. JNK and caspase activation is at least in part associated with NaF-induced toxicity in mESCs
(A) Cells were exposed to the increasing doses (0–5 mM) of NaF for 12 h and then processed for western analysis. Cells were also exposed to the indicated concentrations of NaF in the presence and absence of 2,500 U/ml CAT or 5 μM PFT-α for 12 h and then the (B) levels of p-JNK and total JNK protein, and (C) activity of JNK were detected using western blot analysis and enzyme immunometric assays. In addition, cells were exposed to the indicated concentrations of NaF in the presence and absence of 2.5 μM z-VAD-fmk or 10 μM 4-HPR for 24 h, and (D) caspase 3/7 activities in the lysates or (E) cell viability was analyzed. *p < 0.05 and **p < 0.01 vs. the experiments. In panel D, *p < 0.05 and #p < 0.05 indicate significant differences from the untreated control cells and the 2 mM NaF treatment alone, respectively.
Fig. 6
Fig. 6. Association of mitochondrial stress and intracellular free calcium ions in NaF-mediated reduction of cell viability
(A) The relative percentage of NaF-induced MMP loss was calculated by monitoring the DiOC6 fluorescence intensity shift between the experimental and control values using WinMDI 2.9 (n = 4). (B) Mitochondrial and (C) cytosolic fractions were prepared from cells exposed to the indicated NaF concentrations for 24 h and then analyzed by western blotting. Cells were also incubated with 2 mM NaF at the indicated concentrations of BAPTA-AM (0–10 μM) or 2,500 U/ml CAT, and then (D) cell viability and (E) JNK activity were determined at 24 h and 12 h after the incubation, respectively. *p < 0.05 and **p < 0.01 vs. the untreated controls.
Fig. 7
Fig. 7. ROS act upstream of p53- and JNK-mediated signaling in NaF-exposed cells
(A) Cells were exposed to the indicated concentrations (0–5 mM) of NaF for various times (0–24 h), and then GADD45α protein levels were determined by western blotting. A representative result from triplicate experiments is shown. Cells were also incubated with 5 mM NaF in the presence of the indicated concentrations of SP600125, PFT-α, or CAT for 24 h and then processed for (B) western blotting, (C) MMP determination, and (D) flow cytometric analysis. In panel B, the results represent the mean ± S.D. from triplicate experiments and are expressed as relative expression (fold) to the control value after normalizing the bands to that of β-actin. ***p < 0.001 vs. the untreated control. #p < 0.05 and ###p < 0.05 vs. the 5 mM NaF treatment alone.
Fig. 8
Fig. 8
Proposed signaling pathways involved in NaF-induced apoptosis in mESCs. NaF induces intracellular ROS accumulation, especially H2O2, and this stimulates both p53- and JNK-mediated pathways eventually leading to cell death mainly by apoptosis through the induction of mitochondrial stress, caspase activation, and the increase of GADD45α . Necrotic cell death and cell cycle progression arrest in the G2/M phase also occurred at least in part in the NaF-exposed cells.

References

    1. Barbier O, Arreola-Mendoza L, Del Razo LM. Molecular mechanisms of fluoride toxicity. Chem Biol Interact. 2010;188:319–333. - PubMed
    1. Barbouti A, Doulias PT, Nousis L, Tenopoulou M, Galaris D. DNA damage and apoptosis in hydrogen peroxide-exposed Jurkat cells: bolus addition versus continuous generation. Free Radic Biol Med. 2002;33:691–702. - PubMed
    1. Ba Y, Zhu JY, Yang YJ, Yu B, Huang H, Wang C, Ren LJ, Cheng XM, Cui LX, Zhang YW. Serum calciotropic hormone levels, and dental fluorisis in children exposed to different concentrations of fluoride and iodine in dringking water. Chin Med J. 2010;123:675–679. - PubMed
    1. Bourgoin SG, Harbour D, Poubelle PE. Role of protein kinase C alpha, Arf, and cytoplasmic calcium transients in phospholipase D activation by sodium fluoride in osteoblast-like cells. J Bone Miner Res. 1996;11:1655–1665. - PubMed
    1. Buzalaf MA, Levy SM. Fluoride intake of children: considerations for dental caries and dental fluorosis. Monogr Oral Sci. 2011;22:1–19. - PubMed

Publication types

MeSH terms

LinkOut - more resources