Comparative Study
. 2012 Apr;13(2):204-16.
doi: 10.1093/biostatistics/kxr054. Epub 2012 Jan 27.

Removing technical variability in RNA-seq data using conditional quantile normalization

Affiliations
Comparative Study

Removing technical variability in RNA-seq data using conditional quantile normalization

Kasper D Hansen et al. Biostatistics. 2012 Apr.

Abstract

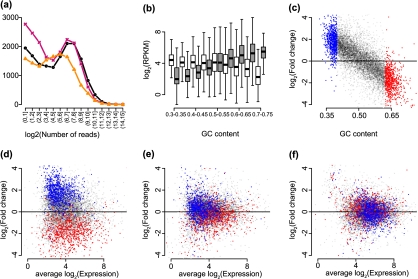
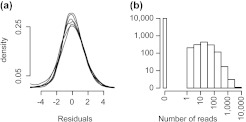
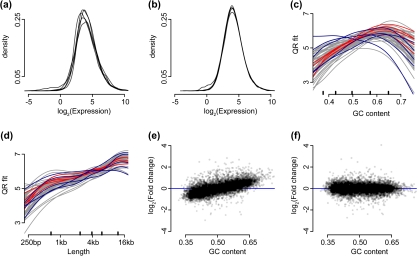
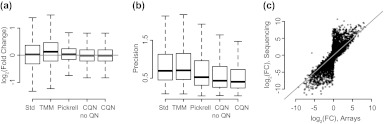
The ability to measure gene expression on a genome-wide scale is one of the most promising accomplishments in molecular biology. Microarrays, the technology that first permitted this, were riddled with problems due to unwanted sources of variability. Many of these problems are now mitigated, after a decade's worth of statistical methodology development. The recently developed RNA sequencing (RNA-seq) technology has generated much excitement in part due to claims of reduced variability in comparison to microarrays. However, we show that RNA-seq data demonstrate unwanted and obscuring variability similar to what was first observed in microarrays. In particular, we find guanine-cytosine content (GC-content) has a strong sample-specific effect on gene expression measurements that, if left uncorrected, leads to false positives in downstream results. We also report on commonly observed data distortions that demonstrate the need for data normalization. Here, we describe a statistical methodology that improves precision by 42% without loss of accuracy. Our resulting conditional quantile normalization algorithm combines robust generalized regression to remove systematic bias introduced by deterministic features such as GC-content and quantile normalization to correct for global distortions.


Figures

Fig. 1.
Fig. 1.
Exploratory plots. (a) The points show the frequency of counts in the bins shown on the x-axis. The 3 colors represent 3 samples (NA12812, NA12874, and NA11993) from the Montgomery data. (b) log2-RPKM values are stratified by GC-content for 2 biological replicates from the Montgomery data (NA11918 and NA12761) and are summarized by boxplots. The 2 samples are distinguished by the 2 colors (colors can be seen in the online version). Genes with average (across all 60 samples) log2-RPKM values below 2 are not shown. (c) Log fold changes between RPKM values from the 2 samples and the same genes shown in (b) were computed and are plotted against GC-content. Red is used to show the genes with the 10% highest GC-content and blue is used to show the genes with the 10% lowest GC-content. (d) RPKM log fold changes are plotted against average log2 counts for the samples and genes shown in (b), with the same color coding as in (c). (e) As (d) but from values corrected using the method proposed by Pickrell and others (2010). (f) As (d) but for values normalized using our approach (see Section 4).
Fig. 2.
Fig. 2.
Empirical distributions. (a) Empirical density estimates of log(Yg,i)f^i,j(Xg,j) are shown for 6 samples from the Montgomery data. (b) A histogram of counts in a single sample for genes with a GC-content of 45 ± 1% and with a length between 500 and 2000 bp is shown.
Fig. 3.
Fig. 3.
Results from normalizing 60 samples. In these plots, we only show genes with a length greater than 100 bp and an average (across all 60 samples) standard log2-RPKM of 2 or greater. (a) Empirical density estimates of log2-RPKM for 5 different biological replicates from the Montgomery data are shown. (b) As (a) but CQN-normalized expression values on the log2-scale are shown. (c) The estimated GC-content effect are shown as curves for all 60 biological replicates in the Montgomery study. We created a 5 versus 5 comparison using the samples highlighted in blue (group 1) and red (group 2) (colors can be seen in the online version). (d) As (c) but curves are shown for the gene length effect instead of GC-content. (e) Average log fold change is plotted against GC-content. Here, we used RPKM values and compared group 2 to group 1. (f) Average log fold change is plotted against GC-content using CQN-normalized expression measures.
Fig. 4.
Fig. 4.
Improved precision provided by CQN on comparisons across studies. (a) We show boxplots of the estimated log fold change between the 2 groups of 5 samples (the same 2 groups as in Figure 3) from the Montgomery data using standard RPKM, expression values normalized by TMM (trimmed median of M-values, the method proposed in Robinson and Oshlack, 2010), the method proposed in Pickrell and others (2010), and CQN with and without quantile normalization. We show genes with length greater than 100 bp and average (across all samples) log2-RPKM greater or equal to 2. (b) We normalized the 29 samples assayed in both Montgomery and Cheung. For each gene, we computed the mean squared difference between the expression measure based on the Montgomery and the Cheung data. The boxplots show the distribution of these precision measures for the highly expressed genes, for each of the 4 choices of normalization: standard RPKM, TMM, the method proposed in Pickrell and others (2010), and CQN. We show genes with length greater than 100 bp and average (across all samples) log2-RPKM greater or equal to 2. (c) For the MicroArray Quality Control data, we obtained fold change estimates between UHR and brain based on RNA-Seq and microarrays. For RNA-seq, we used 2 samples. For the microarrays, we used a 5 versus 5 comparison. The microarray data were normalized using Robust Multiarray Analysis, and the RNA-seq data were normalized by CQN.

References

    1. Aird D, Ross MG, Chen W-S, Danielsson M, Fennell T, Russ C, Jaffe DB, Nusbaum C, Gnirke A. Analyzing and minimizing PCR amplification bias in Illumina sequencing libraries. Genome Biology. 2011;12:R18. - PMC - PubMed
    1. Anders S, Huber W. Differential expression analysis for sequence count data. Genome Biology. 2010;11:R106. - PMC - PubMed
    1. Bolstad BM, Irizarry RA, Åstrand M, Speed TP. A comparison of normalization methods for high density oligonucleotide array data based on variance and bias. Bioinformatics. 2003;19:185–193. - PubMed
    1. Bottomly D, Walter NAR, Hunter JE, Darakjian P, Kawane S, Buck KJ, Searles RP, Mooney M, McWeeney SK, Hitzemann R. Evaluating gene expression in C57BL/6J and DBA/2J mouse striatum using RNA-seq and microarrays. PloS One. 2011;6:e17820. - PMC - PubMed
    1. Bullard JH, Purdom E, Hansen KD, Dudoit S. Evaluation of statistical methods for normalization and differential expression in mRNA-Seq experiments. BMC Bioinformatics. 2010;11:94. - PMC - PubMed

Publication types

MeSH terms