. 2012 Jan 29;482(7384):237-40.
doi: 10.1038/nature10750.

G-protein-coupled receptor inactivation by an allosteric inverse-agonist antibody

Affiliations

G-protein-coupled receptor inactivation by an allosteric inverse-agonist antibody

Tomoya Hino et al. Nature. .

Abstract

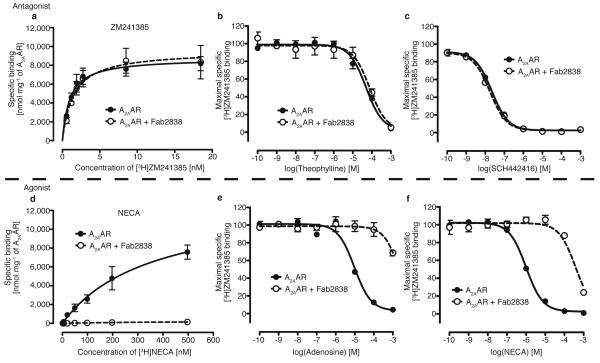
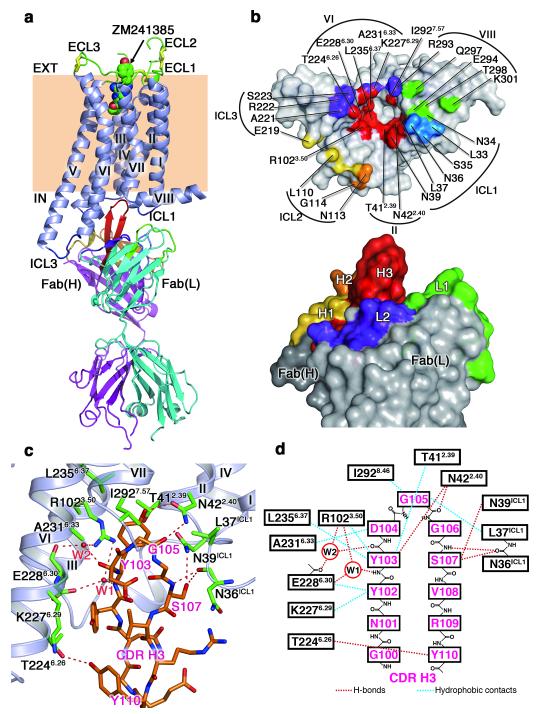
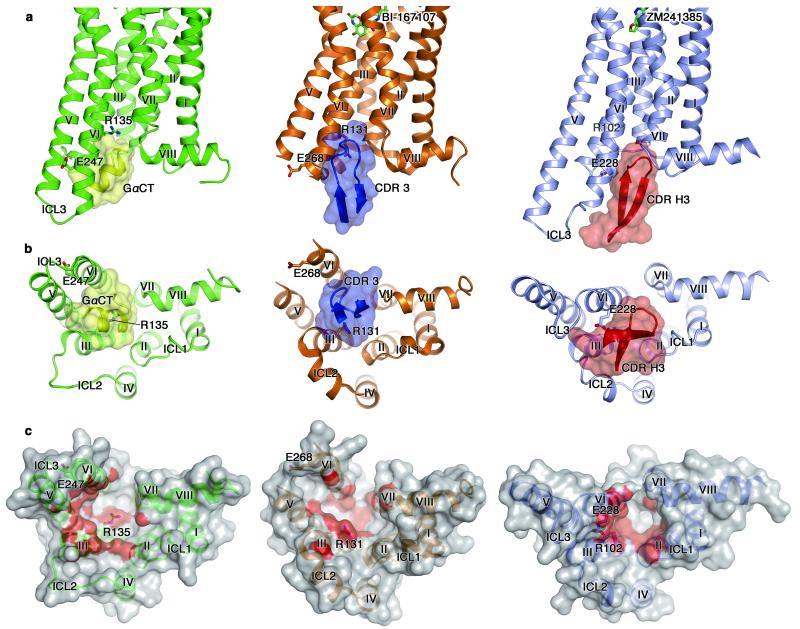
G-protein-coupled receptors are the largest class of cell-surface receptors, and these membrane proteins exist in equilibrium between inactive and active states. Conformational changes induced by extracellular ligands binding to G-protein-coupled receptors result in a cellular response through the activation of G proteins. The A(2A) adenosine receptor (A(2A)AR) is responsible for regulating blood flow to the cardiac muscle and is important in the regulation of glutamate and dopamine release in the brain. Here we report the raising of a mouse monoclonal antibody against human A(2A)AR that prevents agonist but not antagonist binding to the extracellular ligand-binding pocket, and describe the structure of A(2A)AR in complex with the antibody Fab fragment (Fab2838). This structure reveals that Fab2838 recognizes the intracellular surface of A(2A)AR and that its complementarity-determining region, CDR-H3, penetrates into the receptor. CDR-H3 is located in a similar position to the G-protein carboxy-terminal fragment in the active opsin structure and to CDR-3 of the nanobody in the active β(2)-adrenergic receptor structure, but locks A(2A)AR in an inactive conformation. These results suggest a new strategy to modulate the activity of G-protein-coupled receptors.


Figures

Figure 1
Figure 1. Effect of Fab2838 on A2AAR -ligand binding
a, Saturation binding curves for an antagonist [3H]-ZM241385 binding to A2AAR with (open circle) or without (closed circle) Fab2838. b and c, Inhibition of [3H]-ZM241385 binding by the antagonists, theophylline (b) and SCH442416 (c) with (open circles) and without (closed circles) Fab2838. The binding of [3H]-ZM241385 in the absence of competitor was set at 100%. d, Similar to a, but for the agonist [3H]-NECA. e and f, Similar to c and d but for the agonists, adenosine (e) and NECA (f), respectively. All data are the mean ± standard estimated errors (SEM) of three independent experiments performed in duplicate.
Figure 2
Figure 2. Structure of the A2AAR complex with an antibody Fab2838 fragment
a, Overall structure viewed parallel to the membrane. A2AAR and the Fab light and heavy chains are shown in blue-grey, cyan, and magenta, respectively. The three disulfide bonds in the ECLs are represented by yellow sticks. The bound antagonist ZM241385 in the ligand-binding pocket is shown as a space-filling model. The complementarity-determining regions (CDRs) of Fab2838 are as follows: CDR-H1, yellow; CDR-H2, orange; CDR-H3, red; CDR-L1, green; CDR-L2, purple; CDR-L3, marine. b, Surface representation of the interface between A2AAR (top) and Fab2838 (bottom). Compared to a, A2AAR has been rotated 90° around a horizontal axis, whereas Fab2838 is shown in the same orientation. c, View of the A2AAR (green residues) and CDR-H3 (orange residues) interface. Red dotted lines indicate polar interactions. d, Schematic representation of the A2AAR and CDR-H3 interface.
Figure 3
Figure 3. Comparison of the structures of opsin-GαCT, β2AR-Nb80 and A2AAR-Fab2838 complexes
Left, middle and right panels show the structures of an active form of opsin with GαCT (opsin in green and GαCT in yellow), an active form of β2AR with Nb80 CDR-3 (β2AR in brown and Nb80 CDR-3 in blue) and an inactive form of A2AAR with Fab2838 CDR-H3 (A2AAR in blue-grey and Fab2838 CDR-H3 in red). a, Views parallel to the membrane. Bound ligands are shown as stick models in β2AR and A2AAR. The residues involved in the ‘ionic lock’ formation are also shown. Nitrogen and oxygen atoms are in blue and red, respectively. b, Cytoplasmic views of the complexes. c, Surface representations of cytoplasmic surfaces of the receptors. Surfaces within 4 Å of GαCT/CDR-3/CDR-H3 are red.

References

    1. Warne T, Chirnside J, Schertler GFX. Expression and purification of truncated, non-glycosylated turkey beta-adrenergic receptors for crystallization. Biochim. Biophys. Acta. 2003;1610:133–140. - PubMed
    1. Collaborative Computational Project N. The CCP4 suite: programs for protein crystallography. Acta Crystallogr. D. 1994;50:760–763. - PubMed
    1. McCoy AJ, et al. Phaser crystallographic software. J. Appl. Crystallogr. 2007;40:658–674. - PMC - PubMed
    1. Emsley P, Cowtan K. Coot: model-building tools for molecular graphics. Acta Crystallogr. D. 2004;60:2126–2132. - PubMed
    1. Murshudov GN, Vagin AA, Dodson EJ. Refinement of macromolecular structures by the maximum-likelihood method. Acta Crystallogr. D. 1997;53:240–255. - PubMed

Publication types

MeSH terms