. 2012 Mar;402(9):2797-803.
doi: 10.1007/s00216-012-5755-7.

Dynamic monitoring of glucagon secretion from living cells on a microfluidic chip

Affiliations

Dynamic monitoring of glucagon secretion from living cells on a microfluidic chip

Jonathan G Shackman et al. Anal Bioanal Chem. 2012 Mar.

Abstract

A rapid microfluidic based capillary electrophoresis immunoassay (CEIA) was developed for on-line monitoring of glucagon secretion from pancreatic islets of Langerhans. In the device, a cell chamber containing living islets was perfused with buffers containing either high or low glucose concentration. Perfusate was continuously sampled by electroosmosis through a separate channel on the chip. The perfusate was mixed on-line with fluorescein isothiocyanate-labeled glucagon (FITC-glucagon) and monoclonal anti-glucagon antibody. To minimize sample dilution, the on-chip mixing ratio of sampled perfusate to reagents was maximized by allowing reagents to only be added by diffusion. Every 6 s, the reaction mixture was injected onto a 1.5-cm separation channel where free FITC-glucagon and the FITC-glucagon-antibody complex were separated under an electric field of 700 V cm(-1). The immunoassay had a detection limit of 1 nM. Groups of islets were quantitatively monitored for changes in glucagon secretion as the glucose concentration was decreased from 15 to 1 mM in the perfusate revealing a pulse of glucagon secretion during a step change. The highly automated system should be enable studies of the regulation of glucagon and its potential role in diabetes and obesity. The method also further demonstrates the potential of rapid CEIA on microfluidic systems for monitoring cellular function.


Figures

Fig. 1
Fig. 1
Microfluidic device to continuously monitor glucagon release from islets of Langerhans. Channels (lines) and access holes (circles) are drawn to scale. All channels were 6 μm deep. Electrical connections are shown as dashed lines. Perfusion inlet was connected to external gas-pumped liquid system.
Fig. 2
Fig. 2
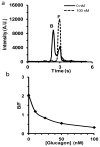
Electropherogram and calibration curve obtained from offline mixing of reagents. (a) Equal volumes of a solution containing 50 nM FITC-glucagon, 25 nM Ab, and 0 (solid) or 100 nM glucagon (dashed) were placed in all three sample reservoirs and injected onto the separation channel for 0.5 s with a separation voltage of −6 kV. (b) Calibration curve for 0–100 nM glucagon mixed with 50 nM FITC-glucagon and 25 nM Ab. Points are the average from 20 consecutive electropherograms, and error bars are ± 1 standard deviation.
Fig. 3
Fig. 3
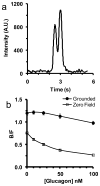
On-line reagent mixing electropherogram and calibration curves obtained from microfluidic device. (a) Electropherogram collected during on-line monitoring of islet secretion. FITC-glucagon complexed with Ab (B) and free FITC-glucagon (F) are denoted. (b) Comparison of calibration curves from 0 to 100 nM glucagon obtained by grounded (circles) and floating potential (squares) FITC-glucagon and Ab reservoirs. Grounded system used 50 nM FITC-glucagon and 25 nM Ab; zero-field used 200 nM FITC-glucagon and 100 nM Ab. Points are the average from 20 consecutive electropherograms, and error bars are 1 standard deviation.
Fig. 4
Fig. 4
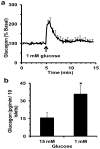
Glucagon release measured from islets of Langerhans on a microfluidic chip. (a) Plot of average glucagon secretion. Glucagon concentration was determined from B/F of individual electropherograms and online calibration; average basal levels were determined by measurement of secretion 5 min prior to stimulation. Step change in glucose is denoted by arrow. Error bars (±SEM) are shown every 5th data point for clarity. n = 4. (b) Comparison of glucagon secretion at 15 mM (basal) and 1 mM glucose (as determined by maximum value). * indicates difference from control with p < 0.01.

References

    1. El-Ali J, Sorger PK, Jensen KF. Nature. 2006;442:403–411. - PubMed
    1. Wlodkowic D, Cooper JM. Curr Opin Chem Biol. 2010;14:556–567. - PubMed
    1. Salieb-Beugelaar GB, Simone G, Arora A, Philippi A, Manz A. Anal Chem. 2010;82:4848–4864. - PubMed
    1. Cheng W, Klauke N, Smith G, Cooper JM. Electrophoresis. 2010;31:1405–1413. - PubMed
    1. Clark AM, Sousa KM, Chisolm CN, MacDougald OA, Kennedy RT. Anal Bioanal Chem. 2010;397:2939–2947. - PMC - PubMed

Publication types

LinkOut - more resources