. 2012 Jan 29;8(3):277-84.
doi: 10.1038/nchembio.773.

Menin-MLL inhibitors reverse oncogenic activity of MLL fusion proteins in leukemia

Affiliations

Menin-MLL inhibitors reverse oncogenic activity of MLL fusion proteins in leukemia

Jolanta Grembecka et al. Nat Chem Biol. .

Abstract

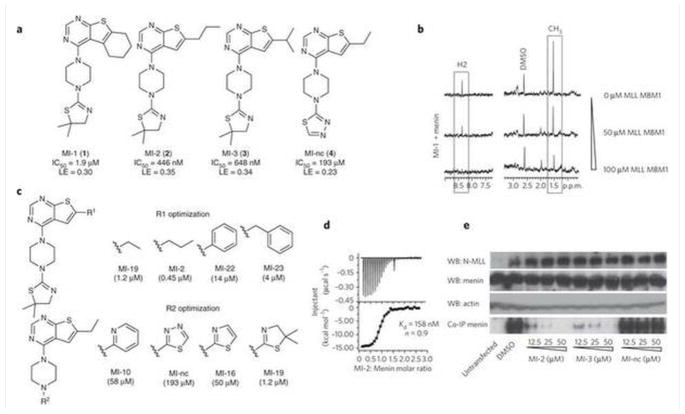
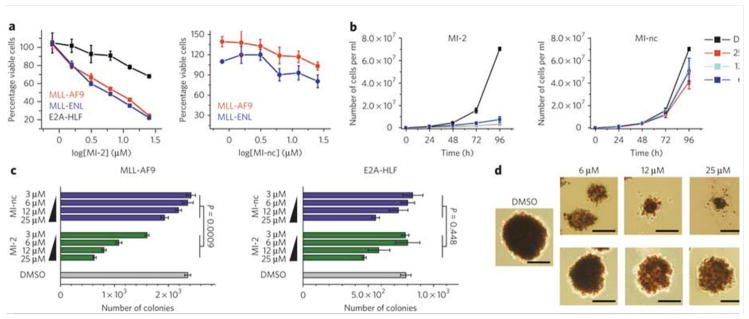
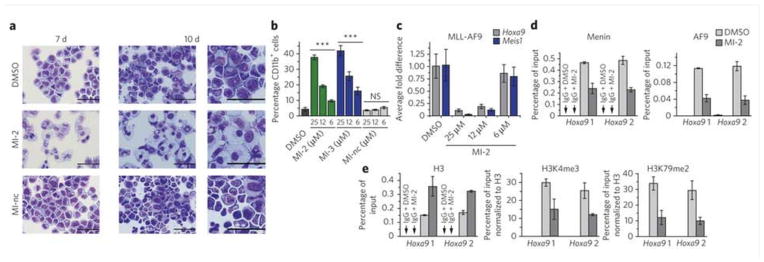
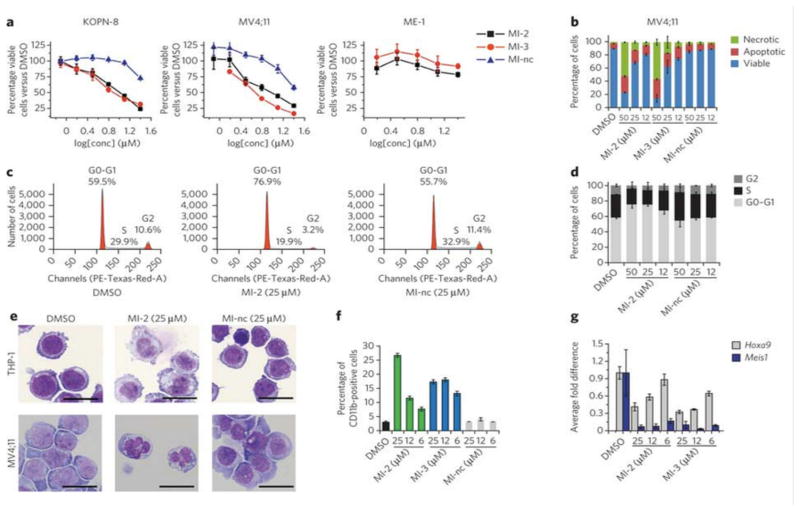
Translocations involving the mixed lineage leukemia (MLL) gene result in human acute leukemias with very poor prognosis. The leukemogenic activity of MLL fusion proteins is critically dependent on their direct interaction with menin, a product of the multiple endocrine neoplasia (MEN1) gene. Here we present what are to our knowledge the first small-molecule inhibitors of the menin-MLL fusion protein interaction that specifically bind menin with nanomolar affinities. These compounds effectively reverse MLL fusion protein-mediated leukemic transformation by downregulating the expression of target genes required for MLL fusion protein oncogenic activity. They also selectively block proliferation and induce both apoptosis and differentiation of leukemia cells harboring MLL translocations. Identification of these compounds provides a new tool for better understanding MLL-mediated leukemogenesis and represents a new approach for studying the role of menin as an oncogenic cofactor of MLL fusion proteins. Our findings also highlight a new therapeutic strategy for aggressive leukemias with MLL rearrangements.


Conflict of interest statement

Competing Financial Interests Statement

The authors declare no competing financial interests.

Figures

Figure 1
Figure 1. Characterization of the menin-MLL inhibitors
(a) Structures and IC50 values measured by FP for the inhibitors of the menin-MLL interaction, MI-1, MI-2, MI-3 and MI-nc. LE (ligand efficiency) values were calculated according to the formula: LE=R*T*ln(IC50)/HA; where R is gas constant, T is temperature and HA is a number of non-hydrogen atoms in the compound. (b) NMR saturation transfer difference (STD) experiments. Top spectrum: 1D STD spectrum of MI-1 (200 μM) with menin (5 μM). Boxes show STD effect for MI-1 signals, corresponding to the aromatic proton from pyrimidine ring (H2) and two methyl groups at thiazoline ring (CH3). Middle and bottom spectra represent STD spectra for MI-1 (200 μM) with menin (5 μM) and increasing concentrations of MLL MBM1 peptide (50 μM and 100 μM, respectively). (c) SAR for selected analogues of MI-1 with different R1 and R2 substituents. (d) ITC experiment demonstrating direct binding of MI-2 to menin with 1:1 stoichiometry. (e) Co-IP experiment in HEK293 cells transfected with Flag-MLL-AF9. MI-nc was used as a negative control. Untransfected cells serve as a control for endogenous expression of menin and lack of MLL-AF9 expression. WB, Western Blot; LE, ligand efficiency; ppm – parts per million; MBM1 – menin binding motif 1.
Figure 2
Figure 2. MI-2 induces growth arrest and inhibits transformation in MLL fusion-transduced bone marrow cells
(a) MI-2 inhibits proliferation of mouse BMC transduced with MLL-AF9 or MLL-ENL but not E2A-HLF (left panel) as detected by MTT cell viability assay. MI-nc is a negative control (right panel). Data represent mean values for quadruplicates ± s.d. Experiments were performed three times. (b) Growth curves for MI-2 (left panel) and MI-nc (right panel) treated MLL-AF9 transduced BMC grown in liquid culture. Data represent mean values for duplicate samples ± s.d. (c) Colony counts for methylcellulose colony assay performed with MLL-AF9 transduced BMC (left panel) and E2A-HLF transduced BMC (right panel) treated for 7 days with MI-2 and MI-nc. Error bars indicate SD from duplicate experiments; two-way ANOVA analysis demonstrates statistical significance of the effect observed for MI-2 as compared to MI-nc (P<0.001) in MLL-AF9 transduced BMC, and no significant difference between MI-2 or MI-nc treated E2A-HLF transduced BMC (P=0.448). Experiments were performed three times. (d) Representative colonies shown for DMSO, MI-2 and MI-nc treated MLL-AF9 transduced BMC plated on methylcellulose. Scale bars are 200 μm.
Figure 3
Figure 3. MI-2 induces hematopoietic differentiation and affects expression of MLL fusion protein target genes
(a) Wright-Giemsa stained cytospins on MLL-AF9 transformed BMC after 7 or 10 days of treatment with DMSO, MI-2 (25 μM) and MI-nc (25 μM). Last column represents zoom for cells after 10 days of treatment. (b) Quantification of CD11b expression in MLL-AF9 transduced BMC treated for 7 days with the menin-MLL inhibitors as detected by flow cytometry. Data represent mean values for triplicates ± s.d. Statistical analysis was performed using one way ANOVA relative to DMSO treated control (*** indicates P < 0.001, ns – not significant). Experiment was performed three times. (c) Quantitative real-time PCR showing the expression of Hoxa9 and Meis1 in MLL-AF9 transduced BMC upon 6 days of treatment with MI-2. Expression of Hoxa9 and Meis1 was normalized to β-actin and referenced to DMSO treated cells. Data represent mean values for triplicates ± s.d. Experiment was performed three times. (d, e) ChIP experiments with antibodies against menin, AF9 and IgG (d), or H3, H3K4me3, H3K79me2 and IgG (e) in the MLL-AF9 transduced BMC after treatment with MI-2 at 12.5 μM or DMSO. Binding was assessed at two sites (Hoxa9 1 and Hoxa9 2) in the promoter region. The signal for H3K4me3 and H3K79me2 was normalized relatively to H3 input. Data represent mean values for duplicate samples ± s.d. Experiment was performed two times.
Figure 4
Figure 4. Effect of MI-2 and MI-3 in human MLL leukemia cells
(a) MTT cell viability assay in the MLL leukemia cells KOPN-8 and MV4;11 induced by MI-2, MI-3 and MI-nc after 72h treatment. Non-MLL leukemia cell line ME-1 is shown for comparison. Data represent mean values for four samples ± s.d. Experiment was performed three times. (b) Apoptosis and cell death induced by MI-2, MI-3 and MI-nc in MV4;11 cells as detected by flow cytometry using AnnexinV/propidium iodide (PI) staining. Data represent mean values for triplicates ± s.d. (c) Selected histograms from cell cycle analysis performed by FACS after PI staining in MV4;11 cells treated with DMSO, MI-2 or MI-nc. (d) Dose-dependent effect of MI-2 on cell cycle progression measured by FACS in MV4;11 cells after PI staining, with MI-nc as a negative control. Data represent mean values for triplicates ± s.d. (e) Wright-Giemsa stained cytospins on THP-1 and MV4;11 cells after 10 days of treatment with DMSO, MI-2 or MI-nc. (f) Detection of CD11b expression in THP-1 cells assessed by flow cytometry after 6 days of treatment with DMSO, MI-2 or MI-nc. Data represent mean values for triplicates ± s.d. (g) Expression of the HOXA9 and MEIS1 genes normalized to 18S rRNA determined by qRT-PCR in THP-1 cells treated for 6 days with MI-2 and MI-3. Data represent mean values for duplicates ± s.d. Experiment was performed three times.

Comment in

  • Targeting menin.
    McCarthy N. McCarthy N. Nat Rev Cancer. 2012 Feb 16;12(3):154. doi: 10.1038/nrc3231. Nat Rev Cancer. 2012. PMID: 22337150 No abstract available.
  • Anticancer drugs: Targeting menin.
    McCarthy N. McCarthy N. Nat Rev Drug Discov. 2012 Mar 1;11(3):190. doi: 10.1038/nrd3689. Nat Rev Drug Discov. 2012. PMID: 22378267 No abstract available.

References

    1. Pui CH, et al. Outcome of treatment in childhood acute lymphoblastic leukaemia with rearrangements of the 11q23 chromosomal region. Lancet. 2002;359:1909–15. - PubMed
    1. Liu H, Cheng EH, Hsieh JJ. MLL fusions: pathways to leukemia. Cancer Biol Ther. 2009;8:1204–11. - PMC - PubMed
    1. Sorensen PH, et al. Molecular rearrangements of the MLL gene are present in most cases of infant acute myeloid leukemia and are strongly correlated with monocytic or myelomonocytic phenotypes. J Clin Invest. 1994;93:429–37. - PMC - PubMed
    1. Cox MC, et al. Chromosomal aberration of the 11q23 locus in acute leukemia and frequency of MLL gene translocation: results in 378 adult patients. Am J Clin Pathol. 2004;122:298–306. - PubMed
    1. Hess JL. MLL: a histone methyltransferase disrupted in leukemia. Trends Mol Med. 2004;10:500–7. - PubMed

Publication types

MeSH terms

Substances