

The combination of a genome-wide association study of lymphocyte count and analysis of gene expression data reveals novel asthma candidate genes
- PMID: 22286170
- PMCID: PMC3315207
- DOI: 10.1093/hmg/dds021
The combination of a genome-wide association study of lymphocyte count and analysis of gene expression data reveals novel asthma candidate genes
Abstract
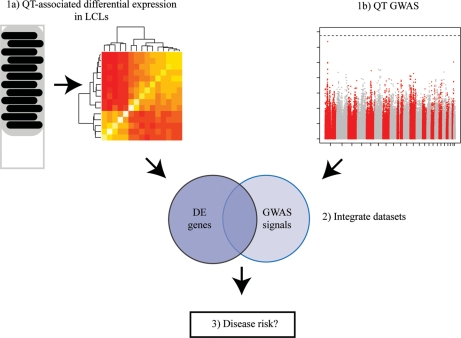
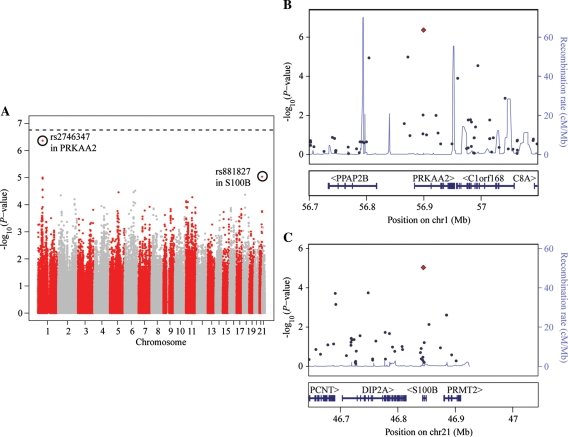
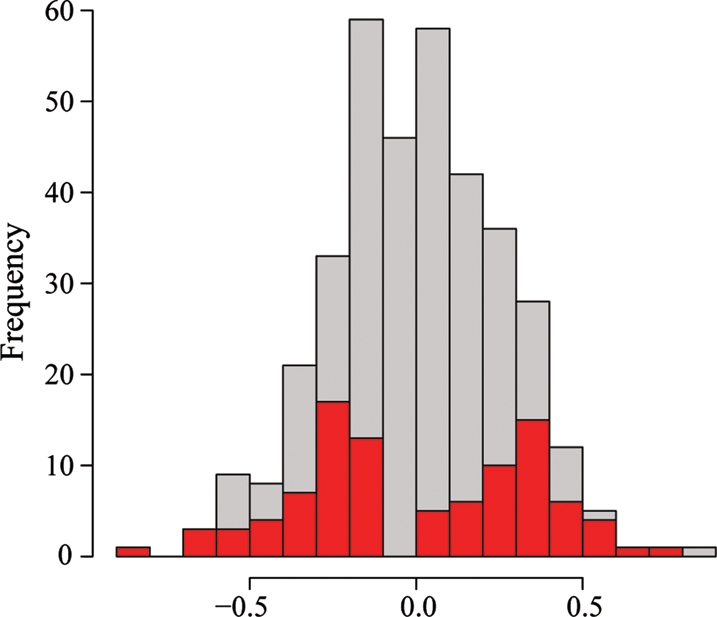
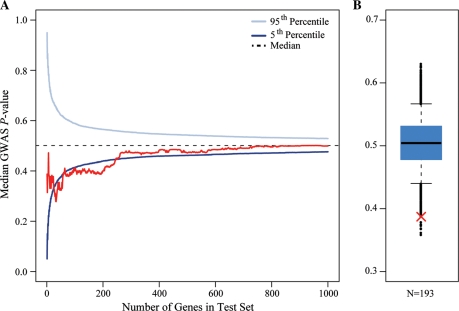
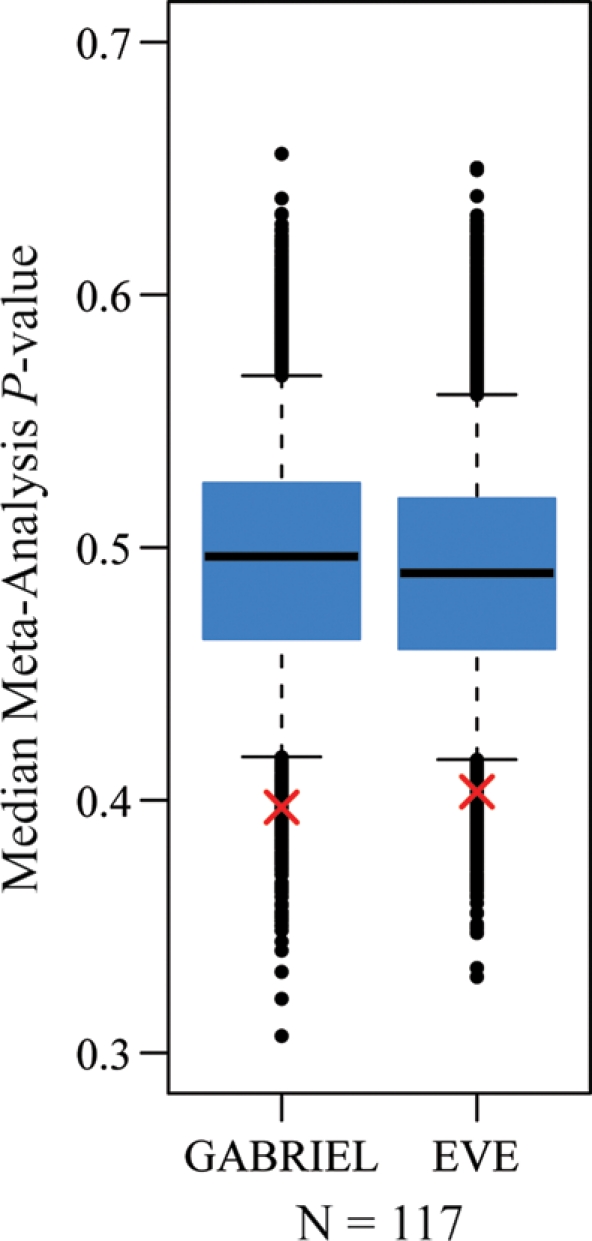
Recent genome-wide association studies (GWAS) have identified a number of novel genetic associations with complex human diseases. In spite of these successes, results from GWAS generally explain only a small proportion of disease heritability, an observation termed the 'missing heritability problem'. Several sources for the missing heritability have been proposed, including the contribution of many common variants with small individual effect sizes, which cannot be reliably found using the standard GWAS approach. The goal of our study was to explore a complimentary approach, which combines GWAS results with functional data in order to identify novel genetic associations with small effect sizes. To do so, we conducted a GWAS for lymphocyte count, a physiologic quantitative trait associated with asthma, in 462 Hutterites. In parallel, we performed a genome-wide gene expression study in lymphoblastoid cell lines from 96 Hutterites. We found significant support for genetic associations using the GWAS data when we considered variants near the 193 genes whose expression levels across individuals were most correlated with lymphocyte counts. Interestingly, these variants are also enriched with signatures of an association with asthma susceptibility, an observation we were able to replicate. The associated loci include genes previously implicated in asthma susceptibility as well as novel candidate genes enriched for functions related to T cell receptor signaling and adenosine triphosphate synthesis. Our results, therefore, establish a new set of asthma susceptibility candidate genes. More generally, our observations support the notion that many loci of small effects influence variation in lymphocyte count and asthma susceptibility.
Figures
References
-
- Manolio T.A., Collins F.S., Cox N.J., Goldstein D.B., Hindorff L.A., Hunter D.J., McCarthy M.I., Ramos E.M., Cardon L.R., Chakravarti A., et al. Finding the missing heritability of complex diseases. Nature. 2009;461:747–753. doi:10.1038/nature08494. - DOI - PMC - PubMed
-
- So H., Gui A.H.S., Cherny S.S., Sham P.C. Evaluating the heritability explained by known susceptibility variants: a survey of ten complex diseases. Genet. Epidemiol. 2011;35:310–317. doi:10.1002/gepi.20579. - DOI - PubMed
-
- Clarke A.J., Cooper D.N. GWAS: heritability missing in action? Eur. J. Hum. Genet. 2010;18:859–861. doi:10.1038/ejhg.2010.35. - DOI - PMC - PubMed
-
- Eichler E.E., Flint J., Gibson G., Kong A., Leal S.M., Moore J.H., Nadeau J.H. Missing heritability and strategies for finding the underlying causes of complex disease. Nat. Rev. Genet. 2010;11:446–450. doi:10.1038/nrg2809. - DOI - PMC - PubMed
-
- Gibson G. Hints of hidden heritability in GWAS. Nat. Genet. 2010;42:558–560. doi:10.1038/ng0710-558. - DOI - PubMed
Publication types
MeSH terms
Grants and funding
LinkOut - more resources
Full Text Sources
Medical
Molecular Biology Databases
