. 2012 May 1;21(9):2054-67.
doi: 10.1093/hmg/dds023. Epub 2012 Jan 27.

Transcriptional analysis of pluripotency reveals the Hippo pathway as a barrier to reprogramming

Affiliations

Transcriptional analysis of pluripotency reveals the Hippo pathway as a barrier to reprogramming

Han Qin et al. Hum Mol Genet. .

Abstract

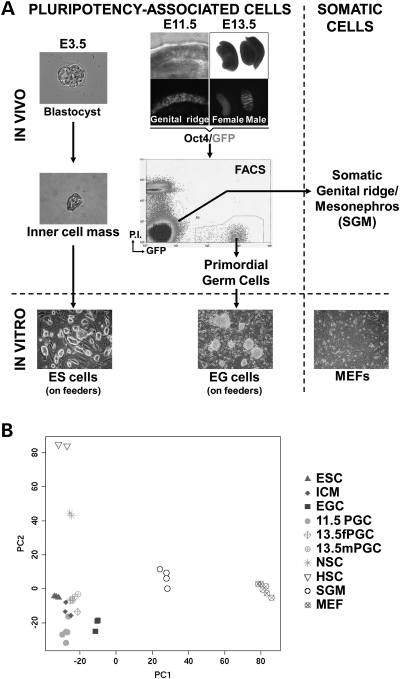
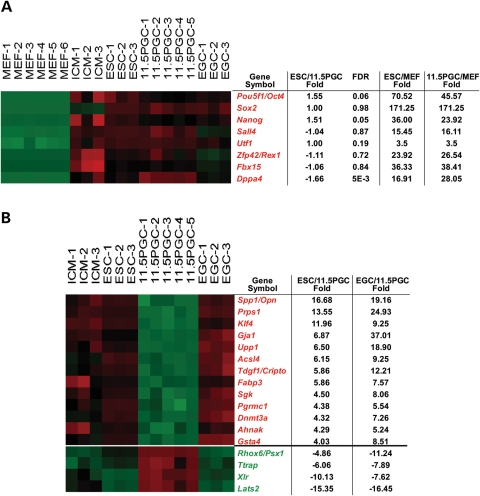
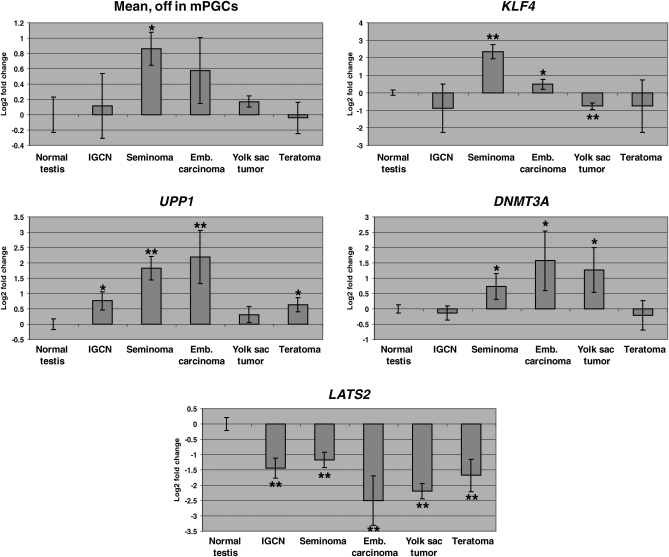
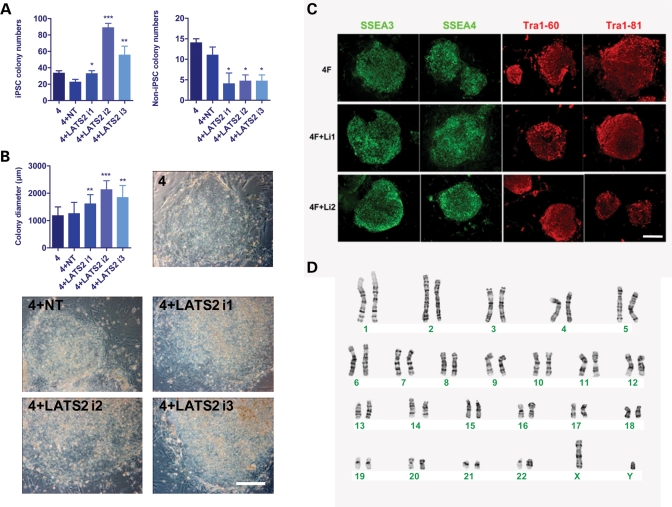
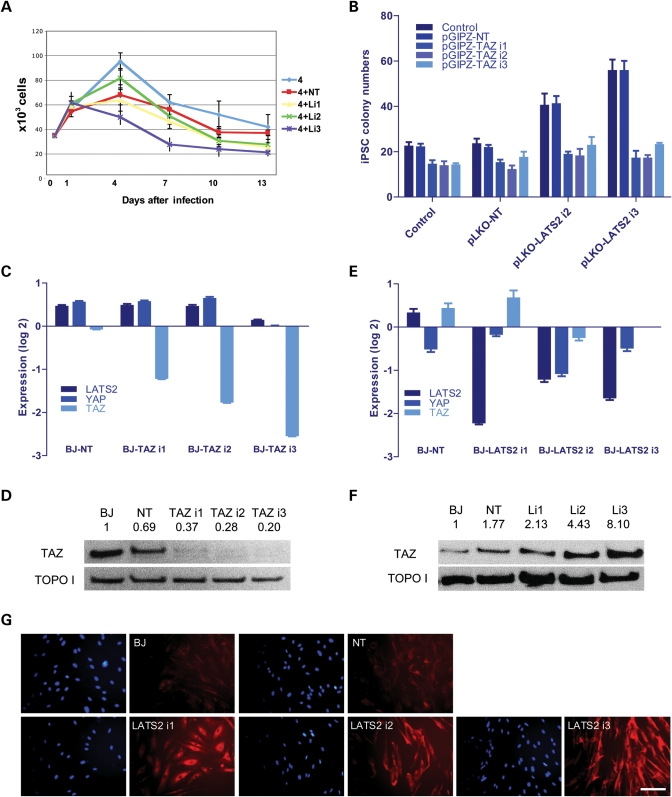
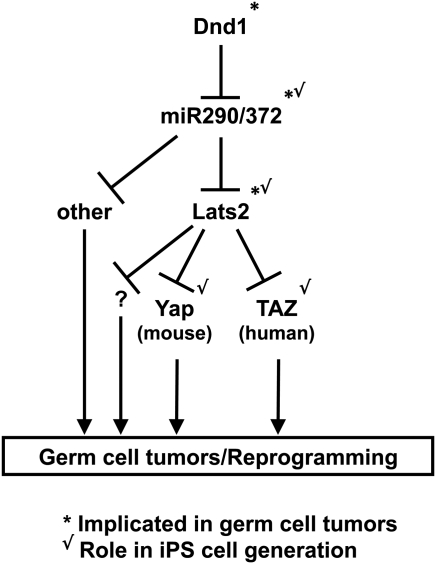
Pluripotent stem cells are derived from culture of early embryos or the germline and can be induced by reprogramming of somatic cells. Barriers to reprogramming that stabilize the differentiated state and have tumor suppression functions are expected to exist. However, we have a limited understanding of what such barriers might be. To find novel barriers to reprogramming to pluripotency, we compared the transcriptional profiles of the mouse germline with pluripotent and somatic cells, in vivo and in vitro. There is a remarkable global expression of the transcriptional program for pluripotency in primordial germ cells (PGCs). We identify parallels between PGC reprogramming to pluripotency and human germ cell tumorigenesis, including the loss of LATS2, a tumor suppressor kinase of the Hippo pathway. We show that knockdown of LATS2 increases the efficiency of induction of pluripotency in human cells. LATS2 RNAi, unlike p53 RNAi, specifically enhances the generation of fully reprogrammed iPS cells without accelerating cell proliferation. We further show that LATS2 represses reprogramming in human cells by post-transcriptionally antagonizing TAZ but not YAP, two downstream effectors of the Hippo pathway. These results reveal transcriptional parallels between germ cell transformation and the generation of iPS cells and indicate that the Hippo pathway constitutes a barrier to cellular reprogramming.


Figures

Figure 1.
Figure 1.
Pluripotent cells in vivo and in vitro express a shared transcriptional program. (A) The transcriptional profiles of mouse inner cell mass (ICM) of the blastocyst, embryonic stem (ES) cells, primordial germ cells (PGCs) and embryonic germ (EG) cells were determined. ICMs were isolated by immunosurgery and PGCs by FACS using Oct4/GFP transgenic embryos. GFP fluorescence images in transgenic E11.5 and E13.5 embryos are shown. Note that E11.5 PGCs, but not E13.5 PGCs, give rise to EG cells when cultured in vitro. Controls used were: Somatic cells of the genital ridge/mesonephros (SGM) and mouse embryonic fibroblasts (MEFs). All cell types were analyzed with three to six replicas per cell type using Affymetrix microarrays. Also analyzed were previously collected data on gene-expression profiles of adult hematopoietic and NSCs (56). (B) Principal component analysis (PCA) of the transcriptional profiles of pluripotent and somatic cells, freshly isolated or in vitro cultured.
Figure 2.
Figure 2.
Few genes are highly differentially expressed between E11.5 PGCs and pluripotent stem cells. (A) Expression of core transcriptional regulators and markers of pluripotency of ES cells and E11.5 PGCs. ES cells and E11.5 PGCs express similarly high levels of Oct4, Sox2, Nanog, Sall4, Utf1, Rex1, Fbx15 and Dppa4. The table shows fold changes in the expression of these genes in ES cells versus E11.5 PGCs, ES cells versus MEFs and E11.5 PGCs versus MEFs. The data are validated by qRT-PCR (Supplementary Material, Table S1). (B) Genes showing high differential expression between E11.5 PGCs and ICM, ESC cells and EG cells. Genes shown were identified as follows: they do not change between ES cells and ICM by more than 4-fold but are differentially expressed between ES cells and E11.5 PGCs and between EG cells and E11.5 PGCs by greater than 4-fold. Differential gene expression in the samples indicated is color-coded: red represents up-regulation, green represents down-regulation. Note the high differential expression of Klf4 and Lats2. The absent/present calls in the microarray data (not shown) and qRT-PCR (Supplementary Material, Table S1) confirm that Klf4 is either expressed at very low levels or not at all in E11.5 PGCs.
Figure 3.
Figure 3.
Transcriptional differences between PGCs and pluripotent stem cells are recapitulated in human germ cell tumors. The expression of genes differentially expressed between mouse E11.5 PGCs and ICM, ES and EG cells was analyzed in the transcriptional profiles of normal human testis and human germ cell tumors (58). ‘Mean’ depicts the average expression pattern (averaged Log2 of signal ratio using as normalizer Universal Human Reference RNA) in human germ cell tumor samples of the orthologs of genes not expressed in mouse PGCs but highly expressed in pluripotent stem cells (top part of Fig. 2B). KLF4, UPP1 and DNMT3A are upregulated in seminomas and/or embryonic carcinomas. LATS2 shows the reverse pattern of expression: it is highly expressed in mouse PGCs but not in pluripotent cells (bottom part of Fig. 2B), and it is strongly downregulated in all types of germ cell tumors analyzed. Note that Y-axes represent Log2 transformations of the fold change relative to normal testis. IGCN, intratubular germ cell neoplasia. Data points are averages from three to four independent tissue/tumor samples. Error bars depict standard deviation. *P < 0.05; **P < 0.005.
Figure 4.
Figure 4.
Knockdown of LATS2 increases the efficiency of human iPS cell generation. (A) The number of Tra1-81-positive iPS cell and Tra-1-81-negative non-iPS cell colonies was counted on d20 after infection of human BJ foreskin fibroblasts with 4F alone (4), 4F + non-targeting shRNA (4 + NT) and 4F + LATS2 shRNA (three different short hairpins targeting LATS2 were independently tested, 4 + LATS2 i1, 4 + LATS2 i2 and 4 + LATS2 i3). Infections were performed in triplicate. Knockdown of LATS2 resulted in a significant increase in the number of Tra1-81-positive iPS cell colonies, and in a significant reduction in the number of Tra1-81-negative iPS cell colonies when compared with 4F + NT. (B) The diameter of iPS cell colonies was measured on d24 after infection of BJ foreskin fibroblasts with 4F alone (4), 4 + NT and 4F + LATS2 i1/2/3. For each condition 10 iPS cell colonies were randomly picked. Knockdown of LATS2 resulted in a significant increase in the diameter of iPS cell colonies. Phase-contrast representative images of a colony for each condition are also shown. (C) The iPS cell clones (P5) generated by 4F alone and 4F + LATS2 i1/2 showed strong, positive staining for all human ES cell-specific markers analyzed by immunostaining. (D) iPS cells (P10) generated by 4F + LATS2 i2 showed a normal male karyotype (46, XY). In all relevant panels, error bars represent standard deviation, and scale bars represent 300 μm. *P < 0.05; **P < 0.01; ***P < 0.001.
Figure 5.
Figure 5.
LATS2 antagonizes human cell reprogramming by repressing TAZ. (A) Growth curves of human fibroblasts infected with 4 factor, 4F + non-targeting shRNA (4 + NT), 4F + LATS2 shRNA (4 + Li1/2/3), counted on d0, d1, d4, d7, d10 and d13 post-infection. Infections were performed in triplicates. LATS2 RNAi did not increase total cell numbers during the first 13 days of reprogramming. Data shown are representative of two independent experiments, and error bars represent standard deviations. (B) TAZ knockdown suppresses the LATS2 RNAi-mediated increase in efficiency of iPS cell generation. The number of iPS cell colonies was counted on d21 after infection of BJ foreskin fibroblasts with 4F alone (control), 4F + non-targeting shRNA (pLKO-NT) and 4F + LATS2 shRNA (pLKO-LATS2 i2/3). For each condition, TAZ was also knocked down by pGIPZ lentivirus infection (pGIPZ-TAZ i1/2/3, with pGIPZ-NT used as a negative control). Infections were performed in triplicates and error bars represent standard deviation. (C) Reduction in the levels of TAZ expression achieved by each of the three shRNA constructs (TAZ i1/2/3) was confirmed by qRT-PCR. The expression of LATS2 and YAP showed no significant change upon TAZ RNAi. (D) Reduction in the levels of TAZ protein expression achieved by each of the three shRNA constructs (TAZ i1/2/3) was confirmed by western blotting. Topoisomerase I (TOPO I) was used as loading control. Numbers indicate densitometry analysis of the TAZ expression level standardized to TOPOI. (E) Reduction in the levels of LATS2 expression achieved by each of the three shRNA constructs was confirmed by qRT-PCR. The mRNA level of TAZ and YAP showed no significant change upon LATS2 RNAi. For (C,E), values were standardized to GAPDH and UBB, and then normalized to uninfected BJ fibroblasts. Note log 2 scale in y-axis: e.g. −2 equals down 4×, −3 equals down 8×, etc. Data are from triplicate PCR reactions, and error bars represent standard deviation. (F) Western blotting shows that LATS2 RNAi (Li1/2/3) increases TAZ protein expression level in human fibroblasts. TOPO I was used as loading control. Numbers indicate densitometry analysis of the TAZ expression level standardized to TOPOI. (G) Immunofluorescence shows that LATS2 RNAi (LATS2 i1/2/3) increases TAZ protein expression level in human fibroblasts. Immunostaining was performed 5 days after infection with lentiviruses. Blue, Dapi; red, TAZ. Scale bars represent 80 μm.
Figure 6.
Figure 6.
Speculative model for the role of the Hippo pathway in germ cell tumorigenesis and reprogramming. Lats2 may be under tight control in PGCs via Dnd1-mediated inhibition of miRNAs of the 290 family. Loss of Dnd1 in PGCs may allow these miRNAs to inhibit their targets, including Lats2. ‘Other’ represents targets of the miRNA 290 family other than Lats2. Question mark (‘?’) represents functions of Lats2 independent of the Hippo pathway effectors Yap and Taz, such as in cell cycle and mitotic stability. Loss of Lats2 de-represses Yap or Taz, which promote reprogramming to the tumorigenic pluripotent stem cell state. Checkmarks indicate cases where a gene has been implicated in germ cell tumorigenesis and/or iPS cell generation in the literature (Dnd1, mir290, Yap) or in this study (Lats2, Taz). The different role for Yap and Taz in mouse versus human cell reprogramming may be due to species- or stage-specific differences. See Discussion section for details.

Similar articles

Cited by

References

    1. Keller G. Embryonic stem cell differentiation: emergence of a new era in biology and medicine. Genes Dev. 2005;19:1129–1155. - PubMed
    1. Smith A.G. Embryo-derived stem cells: of mice and men. Annu. Rev. Cell Dev. Biol. 2001;17:435–462. - PubMed
    1. Stadtfeld M., Hochedlinger K. Induced pluripotency: history, mechanisms, and applications. Genes Dev. 2011;24:2239–2263. - PMC - PubMed
    1. Kiskinis E., Eggan K. Progress toward the clinical application of patient-specific pluripotent stem cells. J. Clin. Invest. 2010;120:51–59. - PMC - PubMed
    1. Evans M.J., Kaufman M.H. Establishment in culture of pluripotential cells from mouse embryos. Nature. 1981;292:154–156. - PubMed

Publication types

MeSH terms