

Methylation of AR locus does not always reflect X chromosome inactivation state
- PMID: 22286197
- PMCID: PMC3321879
- DOI: 10.1182/blood-2011-11-390351
Methylation of AR locus does not always reflect X chromosome inactivation state
Erratum in
- Blood. 2012 Nov 22;120(22):4447. Cairns, Bradley [corrected to Cairns, Bradley R]
Abstract
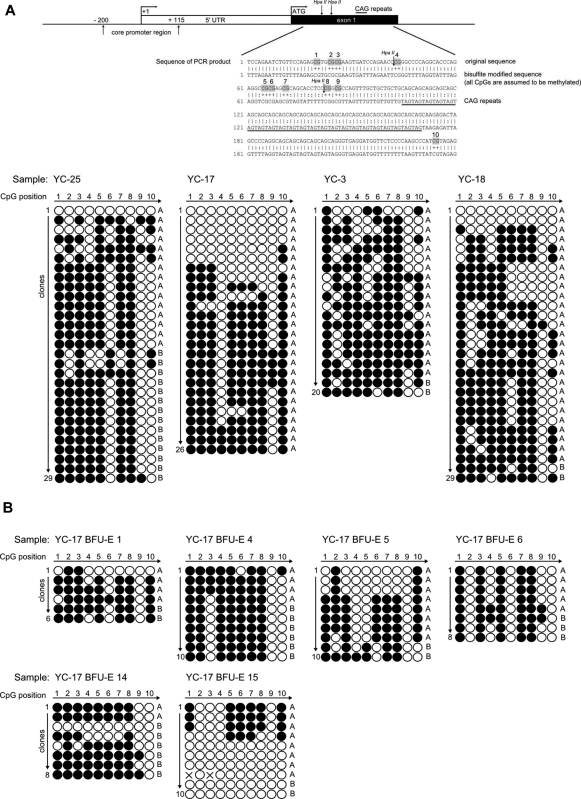
Clonality can be established by a lack of mosaicism in a female because of random inactivation of either the maternal or paternal X chromosome early in embryogenesis. The methylation status of CpG sites close to the trinucleotide repeats in exon 1 of the human androgen receptor (AR) X chromosome gene assay (HUMARA) has been used to determine clonality. This HUMARA at times indicated clonal hematopoiesis in healthy elderly women, thus precluding its applicability. We used a clonality assay based on quantitative expression of polymorphic X chromosome genes (qTCA) and found no evidence of clonal hematopoiesis in healthy nonanemic elderly persons. We found instances of discordance between HUMARA results and those obtained by pyrosequencing and qTCA methods, as well as by directly quantifying AR gene expression. To determine the basis of this discrepancy we examined the methylation pattern of the AR locus subject to HUMARA. Notably, we found the extent of DNA methylation to be highly variable at the AR gene in granulocytes of persons with discordant results and also in erythroid burst-forming unit colonies but not in those with clonal hematopoiesis. These data provide the molecular basis of incomplete correlation with the pattern of DNA methylation of this X chromosome AR gene locus.
Figures


Similar articles
-
Hematopoiesis is not clonal in healthy elderly women.Blood. 2008 Oct 15;112(8):3186-93. doi: 10.1182/blood-2008-03-143925. Epub 2008 Jul 18. Blood. 2008. PMID: 18641369 Free PMC article.
-
Nonrandom X chromosome inactivation detection.Curr Protoc Hum Genet. 2014 Jan 21;80:9.7.1-9.7.7. doi: 10.1002/0471142905.hg0907s80. Curr Protoc Hum Genet. 2014. PMID: 24510685
-
Identification of novel informative loci for DNA-based X-inactivation analysis.Blood Cells Mol Dis. 2015 Feb;54(2):210-6. doi: 10.1016/j.bcmd.2014.10.001. Epub 2014 Nov 20. Blood Cells Mol Dis. 2015. PMID: 25455112
-
60 Years of clonal hematopoiesis research: From X-chromosome inactivation studies to the identification of driver mutations.Exp Hematol. 2020 Mar;83:2-11. doi: 10.1016/j.exphem.2020.01.008. Epub 2020 Jan 28. Exp Hematol. 2020. PMID: 32001340 Review.
-
X-linked clonality testing: interpretation and limitations.Blood. 2007 Sep 1;110(5):1411-9. doi: 10.1182/blood-2006-09-018655. Epub 2007 Apr 13. Blood. 2007. PMID: 17435115 Free PMC article. Review.
Cited by
-
Buccal swab as a reliable predictor for X inactivation ratio in inaccessible tissues.J Med Genet. 2015 Nov;52(11):784-90. doi: 10.1136/jmedgenet-2015-103194. Epub 2015 Jul 28. J Med Genet. 2015. PMID: 26220467 Free PMC article.
-
Skewed X-inactivation is common in the general female population.Eur J Hum Genet. 2019 Mar;27(3):455-465. doi: 10.1038/s41431-018-0291-3. Epub 2018 Dec 14. Eur J Hum Genet. 2019. PMID: 30552425 Free PMC article.
-
Random X chromosome inactivation in patients with Klinefelter syndrome.Mol Cell Pediatr. 2020 Jan 24;7(1):1. doi: 10.1186/s40348-020-0093-x. Mol Cell Pediatr. 2020. PMID: 31974854 Free PMC article.
-
Characterization of X chromosome inactivation using integrated analysis of whole-exome and mRNA sequencing.PLoS One. 2014 Dec 12;9(12):e113036. doi: 10.1371/journal.pone.0113036. eCollection 2014. PLoS One. 2014. PMID: 25503791 Free PMC article.
-
Dosage Compensation in Females with X-Linked Metabolic Disorders.Int J Mol Sci. 2021 Apr 26;22(9):4514. doi: 10.3390/ijms22094514. Int J Mol Sci. 2021. PMID: 33925963 Free PMC article. Review.
References
-
- Busque L, Mio R, Mattioli J, et al. Nonrandom X-inactivation patterns in normal females: lyonization ratios vary with age. Blood. 1996;88(1):59–65. - PubMed
-
- Champion KM, Gilbert JG, Asimakopoulos FA, Hinshelwood S, Green AR. Clonal haemopoiesis in normal elderly women: implications for the myeloproliferative disorders and myelodysplastic syndromes. Br J Haematol. 1997;97(4):920–926. - PubMed
Publication types
MeSH terms
Substances
Grants and funding
LinkOut - more resources
Full Text Sources
Other Literature Sources
Research Materials
Miscellaneous
