. 2012 Jan 29;44(3):285-90.
doi: 10.1038/ng.1050.

Chromosome-scale selective sweeps shape Caenorhabditis elegans genomic diversity

Affiliations

Chromosome-scale selective sweeps shape Caenorhabditis elegans genomic diversity

Erik C Andersen et al. Nat Genet. .

Abstract

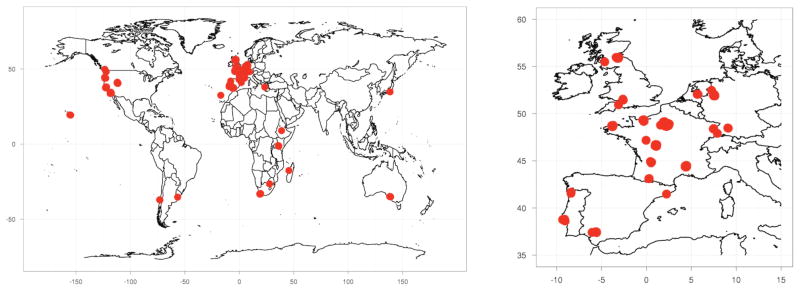
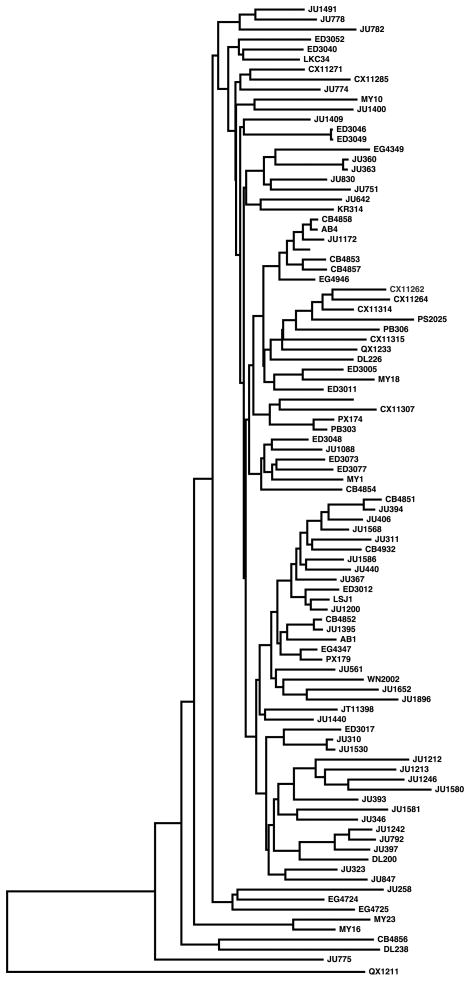
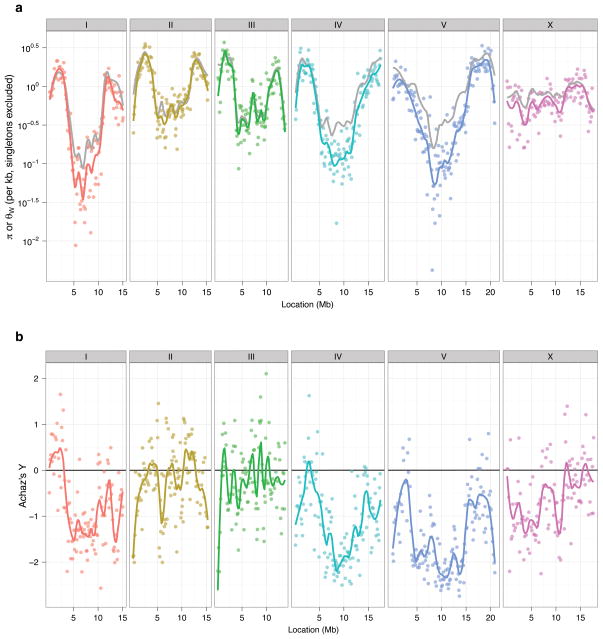
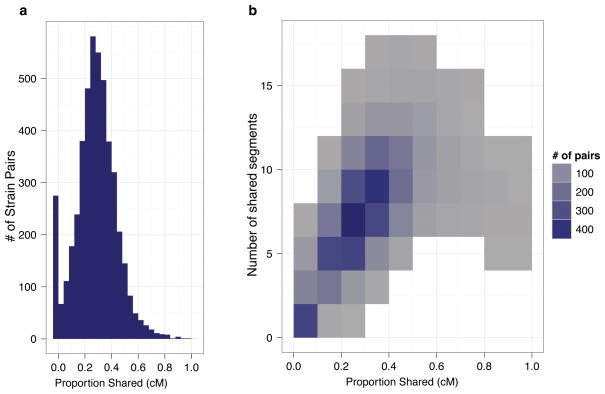
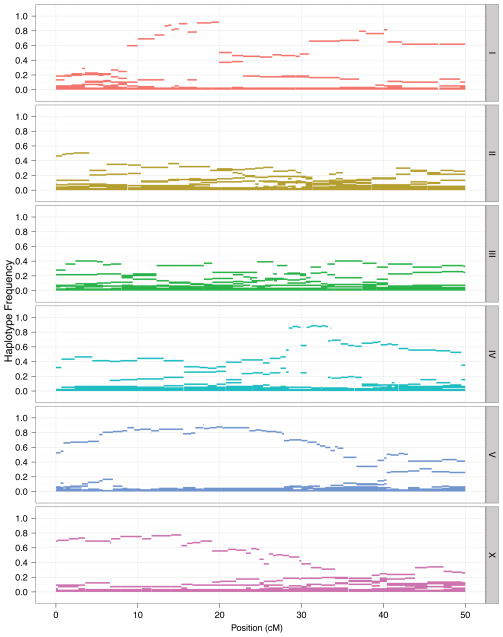
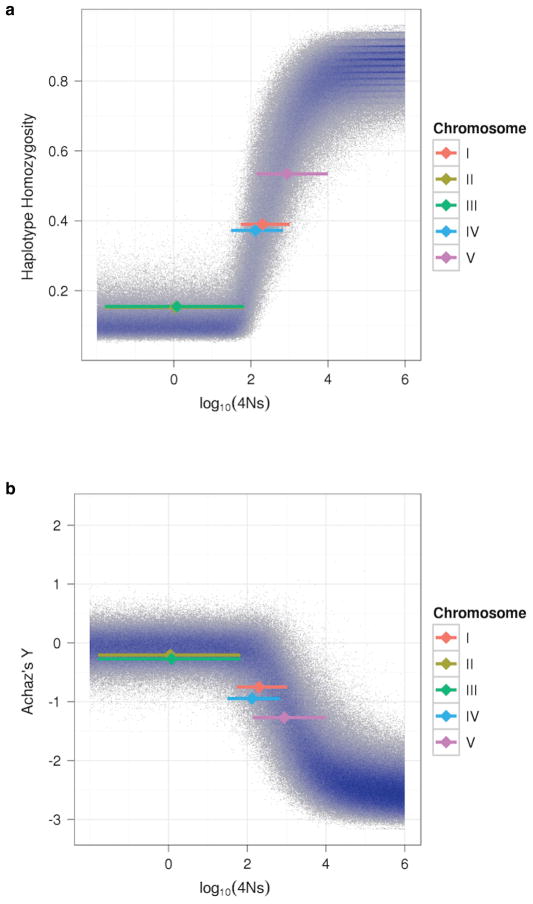
The nematode Caenorhabditis elegans is central to research in molecular, cell and developmental biology, but nearly all of this research has been conducted on a single strain of C. elegans. Little is known about the population genomic and evolutionary history of this species. We characterized C. elegans genetic variation using high-throughput selective sequencing of a worldwide collection of 200 wild strains and identified 41,188 SNPs. Notably, C. elegans genome variation is dominated by a set of commonly shared haplotypes on four of its six chromosomes, each spanning many megabases. Population genetic modeling showed that this pattern was generated by chromosome-scale selective sweeps that have reduced variation worldwide; at least one of these sweeps probably occurred in the last few hundred years. These sweeps, which we hypothesize to be a result of human activity, have drastically reshaped the global C. elegans population in the recent past.


Conflict of interest statement

Competing Financial Interests

The authors declare no competing financial interests.

Figures

Figure 1
Figure 1. Global sampling locations of C. elegans strains
The isolation locations of wild strains sequenced in this study are shown as red circles on the world map. The right panel is a map of the more densely sampled Western Europe.
Figure 2
Figure 2. Neighbor-joining tree of 97 C. elegans isotypes
The tree was constructed using 40,857 polymorphisms in the set of 97 isotypes and pseudo-rooted to QX1211 for visualization reasons. Branch lengths are proportional to the number of polymorphisms that differentiate each pair. Scale bar is the
Figure 3
Figure 3. Chromosomal patterns of sequence polymorphism
a, Two estimates of population polymorphism rate, π (colored points and lines) and θW (grey lines), are shown for each chromosome. Each point represents a non-overlapping window of 110 RAD tags (approximately 10 kb of sequence). The lines show a locally weighted polynomial regression. b, Achaz’s Y, a measure of deviation from the neutral allele frequency spectrum, calculated over the same windows with local polynomial regression. Negative values indicate an excess of rare alleles.
Figure 4
Figure 4. Extensive sharing of large blocks of near-identical haplotypes
a, Proportion of the genetic map shared (as determined by GERMLINE) for every pairwise comparison of the 97 isotypes is shown as a histogram. Notably, every pairwise comparison with one the most diverged isotypes (CB4856, DL238, and QX1211) shows little to no sharing. By contrast, the average sharing between a pair is one third of the genetic map. b, Two-dimensional density plot of the number of shared segments and the proportion of the genetic map shared shows that most isotype pairs share about one third of the genome in six to ten segments, indicating that the shared segments are large.
Figure 5
Figure 5. High-frequency extended haplotypes on chromosomes I, IV, V, and X
The chromosomal region (in Mb) covered by each haplotype block is shown as a bar along the x-axis, with haplotype frequency indicated by height on the y-axis.
Figure 6
Figure 6. Modeled effects of selection
Results from 106 coalescent simulations of chromosomes with a single positively selected site in the center of the chromosome (Methods) are plotted. Regions with a high density of points are indicated in blue. Achaz’s Y (a) and haplotype homozygosity (b) for the entire chromosome are plotted against the simulated selection coefficient 4Ns. The values observed in our experimental data for each chromosome are indicated by the vertical positions of the colored diamonds. The location of each diamond on the x-axis is the median 4Ns as estimated from the simulated data, with the extent of the bar showing the 90% credible interval.

Comment in

References

    1. Felix MA, Braendle C. The natural history of Caenorhabditis elegans. Curr Biol. 2010;20:R965–9. - PubMed
    1. Riddle DL, Blumenthal T, Meyer BJ, Priess JR. C Elegans II. xvii. Cold Spring Harbor Laboratory Press; Plainview, N.Y: 1997. p. 1222. - PubMed
    1. Barriere A, Felix MA. High local genetic diversity and low outcrossing rate in Caenorhabditis elegans natural populations. Curr Biol. 2005;15:1176–84. - PubMed
    1. Barriere A, Felix MA. Temporal dynamics and linkage disequilibrium in natural Caenorhabditis elegans populations. Genetics. 2007;176:999–1011. - PMC - PubMed
    1. Cutter AD, Payseur BA. Selection at linked sites in the partial selfer Caenorhabditis elegans. Mol Biol Evol. 2003;20:665–73. - PubMed

Publication types