. 2012 Jan 29;9(3):283-9.
doi: 10.1038/nmeth.1861.

Computational modeling of cellular signaling processes embedded into dynamic spatial contexts

Affiliations

Computational modeling of cellular signaling processes embedded into dynamic spatial contexts

Bastian R Angermann et al. Nat Methods. .

Abstract

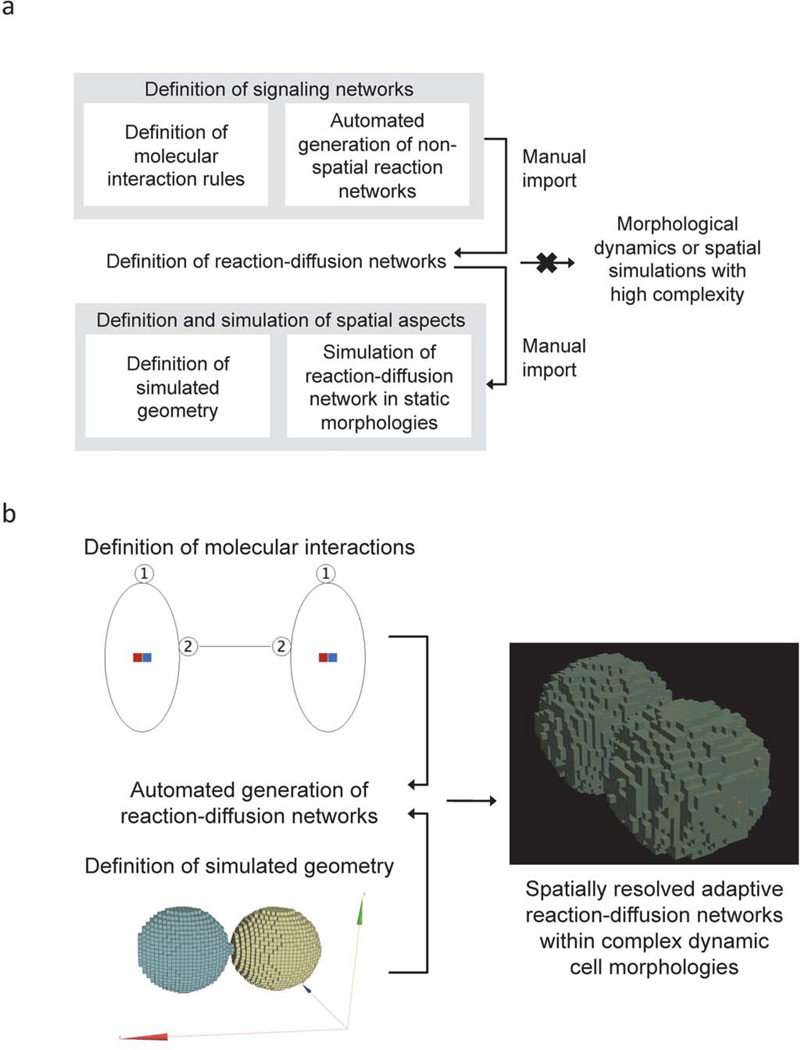
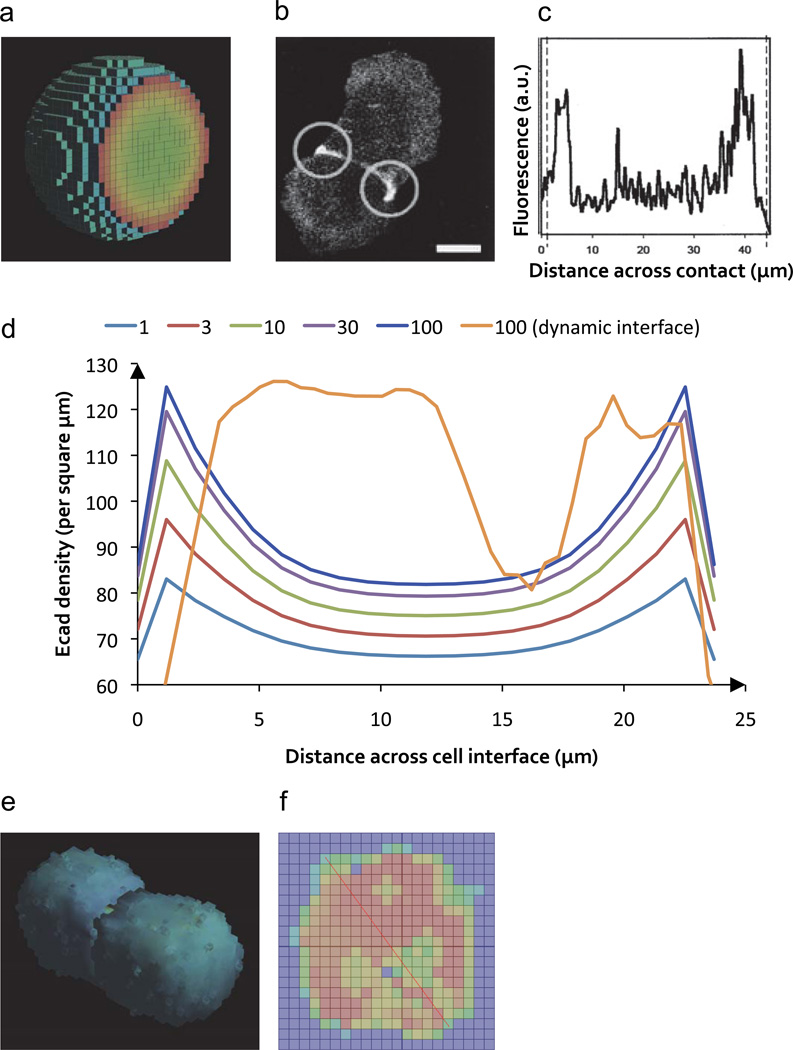
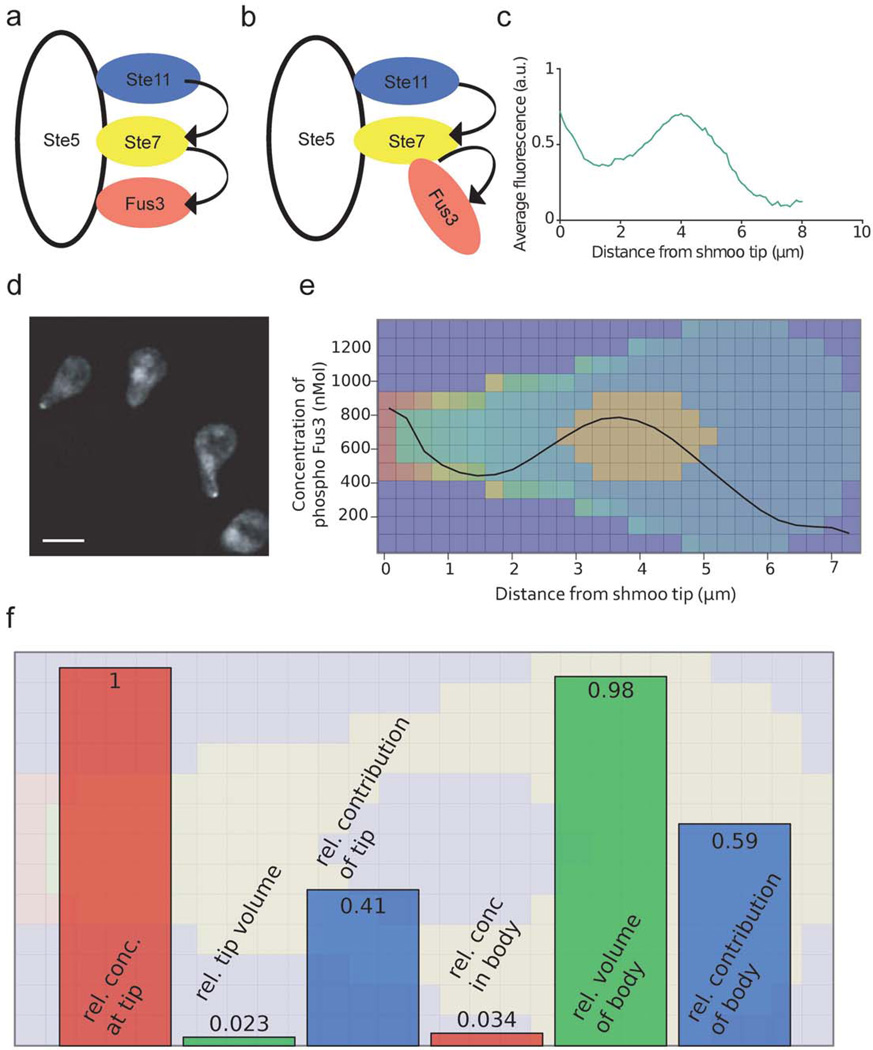
Cellular signaling processes depend on spatiotemporal distributions of molecular components. Multicolor, high-resolution microscopy permits detailed assessment of such distributions, providing input for fine-grained computational models that explore mechanisms governing dynamic assembly of multimolecular complexes and their role in shaping cellular behavior. However, it is challenging to incorporate into such models both complex molecular reaction cascades and the spatial localization of signaling components in dynamic cellular morphologies. Here we introduce an approach to address these challenges by automatically generating computational representations of complex reaction networks based on simple bimolecular interaction rules embedded into detailed, adaptive models of cellular morphology. Using examples of receptor-mediated cellular adhesion and signal-induced localized mitogen-activated protein kinase (MAPK) activation in yeast, we illustrate the capacity of this simulation technique to provide insights into cell biological processes. The modeling algorithms, implemented in a new version of the Simmune toolset, are accessible through intuitive graphical interfaces and programming libraries.


Figures

Figure 1
Figure 1. Automated spatially-resolved generation of reaction networks to simulate cellular signaling in realistic morphologies
a) The schematic illustrates that non-spatial ‘rule-based’ modeling methods can generate signaling networks based on pairwise molecular interactions but cannot take into account the specific localizations of the molecules. Automatically-generated non-spatial networks would have to be translated manually (‘imported’) into reaction-diffusion networks and then inserted into the simulated space by assigning molecular species to specific locations. Non-rule-based spatial simulation tools, on the other hand, allow users to define simulated geometries and simulate pre-defined reaction-diffusion networks within them. Extending the latter simulations to dynamic morphologies or to spatial simulations of highly complex reaction networks is, however, not possible because the reaction-diffusion networks must be fully specified prior to performing the spatially-resolved simulation. b) Simmune’s spatially-resolved automated network generator permits the definition of reaction networks based on molecular interaction rules and then generates and simulates reaction-diffusion networks while adapting them to potentially dynamic cellular morphologies such as shown here for the simulation of cell-cell contact formation.
Figure 2
Figure 2. From non-spatial to spatial representations of E-cadherin interactions
a) E-cadherin receptors can interact in cis (within one membrane) and in trans (linking two adjacent membranes). b) The schematic shows the E-cadherin reaction network assuming one cis- and one trans- binding site per receptor, without taking into account the membrane localization of the receptors. The roman numerals V, VI, VII label complexes for the discussion in Supplementary Note 2. Reactions in cis are represented by blue arrows, interactions in trans by orange arrows. Associations between identical components are labeled ‘self’.c) The schematic shows the consequence of embedding the network of (b) into the spatial context of two adjacent membranes. The solid lines indicate reaction possibilities (blue: cis, yellow: trans), the dotted arrows connect initial and resulting complexes for association reactions. For example, complex (1) can associate with (4) (as indicated by a solid yellow line between (1) and (4)) to form (6) (dotted arrow from (1) to (6)). The color gradients of the E-cadherin molecules (ranging from green to blue or from purple to blue) indicate that the complexes are treated as embedded in two adjacent membranes; blue indicates the intercellular domains. The number labels correspond to the numbering of the differential equations in Supplementary Note 2b.
Figure 3
Figure 3. Automatic creation of an E-cadherin trimer for a membrane contact reaction network
The depicted flow diagram illustrates how the algorithms that are part of our approach automatically create spatially resolved reactions and complexes based on simple user-provided rules specifying molecular interactions. The membrane of a volume element with index i in cell 2 (VE 2_i) contains a monomer that can bind through a cis-interaction to a trans-dimer. If no trans-dimer is present in VE 2_i the algorithm will look for the next potential interaction partner. If it is present in VE 2_i the algorithm will check whether the site capable of mediating the cis-interaction with the monomer is located in VE 2_i (it could be that the trans-dimer has no available cis binding site). If the binding site is available the algorithm will determine whether such a trimer (with two molecules located in the membrane of VE 2_i and one in the adjacent membrane of VE 1_i) is already represented as a complex within the biochemistry of VE 2_i in which case this complex representation will be used as the result complex of the association. Otherwise, a result trimer complex will be built within the biochemistry of VE 2_i. Since the result trimer also is ‘visible’ in the membrane element of VE 1_i it has to be inserted or identified in that reaction network as well. Finally, the reaction information is completed by assembling a code for the association of the monomer with the trans-dimer resulting in the formation of the trimer as result complex and with the reaction rate as specified by the user-supplied association rate between the involved binding sites.
Figure 4
Figure 4. E-cadherin accumulation at static or dynamic cell contacts
a) View of one of the two simulated cells interacting at a static interface with color-coded (from blue: low to red: high) local concentrations of E-cadherin. b, c) Experimental data showing that interacting cells accumulate fluorescently labeled E-cadherin at the periphery of their interfaces (© Rockefeller University Press, 1998. Originally published in J. Cell Biol. 142:1105–1119, reproduced with permission). Scale bar, 15 microns. Panel (c) shows the fluorescence line profile along the length of the cell-cell interface. d) The plot shows simulated E-cadherin density at the cell-cell interface (after 30 minutes of contact) with varying lifespan (1–100 seconds) of the cis interaction within E-cadherin complexes. For a lifespan of 100 seconds, both a static and dynamic interface are shown. e, f) Cell-cell contact after 1.5 simulated hours based on cellular Potts model dynamics. Panel (f) shows the color-coded E-cadherin concentration (red: high, blue: low) at the dynamic cellular interface. The red line was used to determine the concentration profile shown as the orange curve in part (d) of this figure. One voxel has a side length of 1.29 micrometers.
Figure 5
Figure 5. Experimental and simulated patterns of Fus3 phosphorylation
a, b) The schematic shows the conventional ‘in-scaffold’ activation scheme (a) for Fus3 and an alternative activation scheme (b) according to which scaffold-bound Ste7 activates Fus3 that is not bound to Ste5. Arrows indicate kinase activity. c) Experimentally reported concentration profile of Fus3 (© Nature Publishing Group, originally published in Nature Cell Biology 9(11):1319–26, 2007, reproduced with permission). d) Yeast cell with Fus3 accumulation in the shmoo after stimulation with pheromone. Scale bar, 5 microns. (© Nature Publishing Group, originally published in Nature Cell Biology 9(11):1319–26, 2007, reproduced with permission). e) Overlay of the simulated concentration profile of phosphorylated Fus3 as a function of the distance from the shmoo tip and color-coded concentration (from red: high to blue: low) within a central plane through the simulated yeast cell. Side length of one square is 0.28 micrometers. f) The schematic shows the relative concentrations of the pFus3 producing complexes at the shmoo tip and in the cell body (red squares), the relative volumes of the two spatial regions (green squares) and the resulting relative contributions to the total pFus3 production (blue squares).

Similar articles

Cited by

References

    1. Lingwood D, Simons K. Lipid rafts as a membrane-organizing principle. Science. 2010;327:46–50. - PubMed
    1. Kholodenko BN. Four-dimensional organization of protein kinase signaling cascades: the roles of diffusion, endocytosis and molecular motors. J Exp Biol. 2003;206:2073–2082. - PubMed
    1. Delon J, Germain RN. Information transfer at the immunological synapse. Curr Biol. 2000;10:R923–R933. - PubMed
    1. Jones RB, Gordus A, Krall JA, MacBeath G. A quantitative protein interaction network for the ErbB receptors using protein microarrays. Nature. 2006;439:168–174. - PubMed
    1. Brown MD, Sacks DB. Protein scaffolds in MAP kinase signalling. Cell Signal. 2009;21:462–469. - PMC - PubMed

Publication types

LinkOut - more resources