. 2012 Apr;13(2):219-35.
doi: 10.1007/s10162-011-0310-3.

Modeling the anti-masking effects of the olivocochlear reflex in auditory nerve responses to tones in sustained noise

Affiliations

Modeling the anti-masking effects of the olivocochlear reflex in auditory nerve responses to tones in sustained noise

Ananthakrishna Chintanpalli et al. J Assoc Res Otolaryngol. 2012 Apr.

Abstract

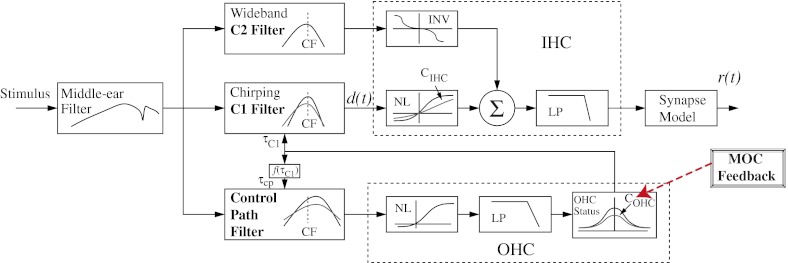
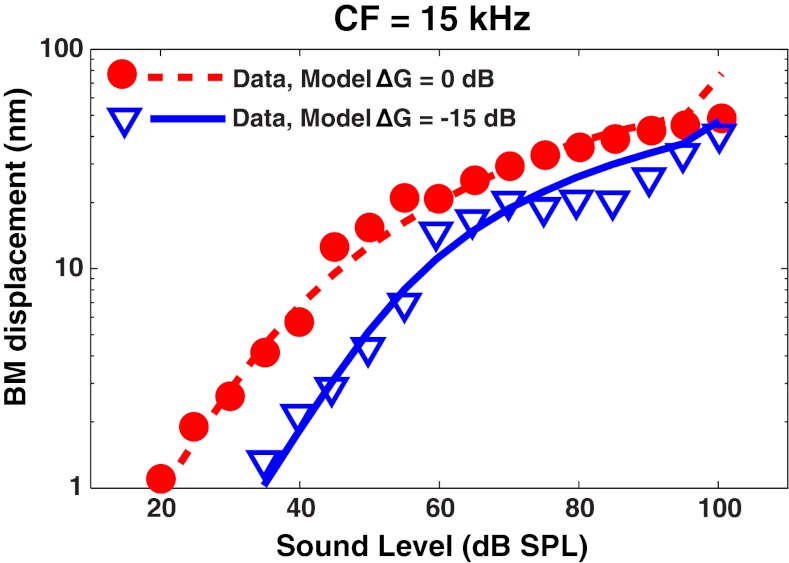
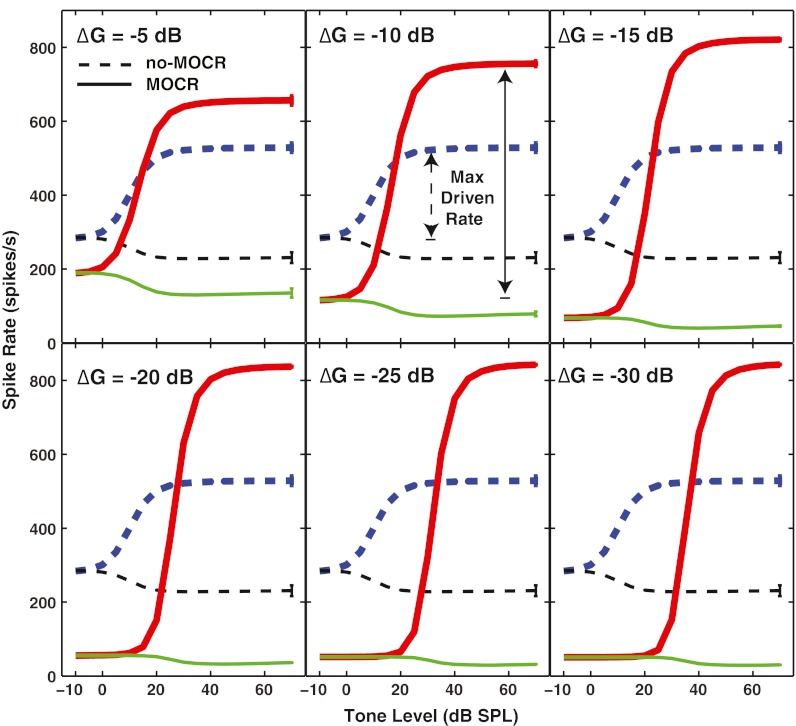
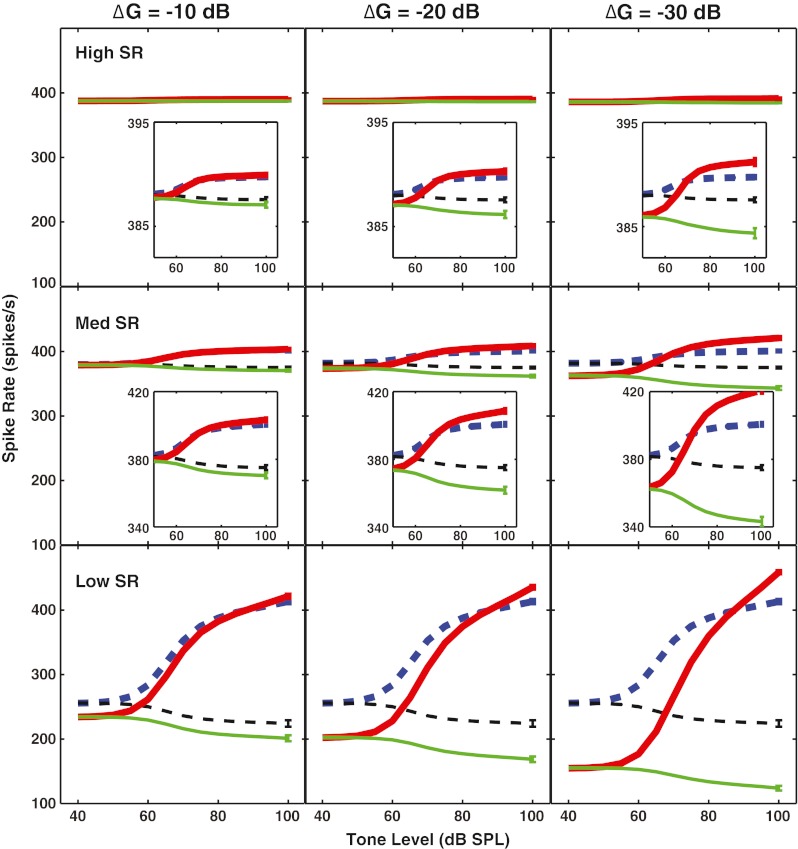
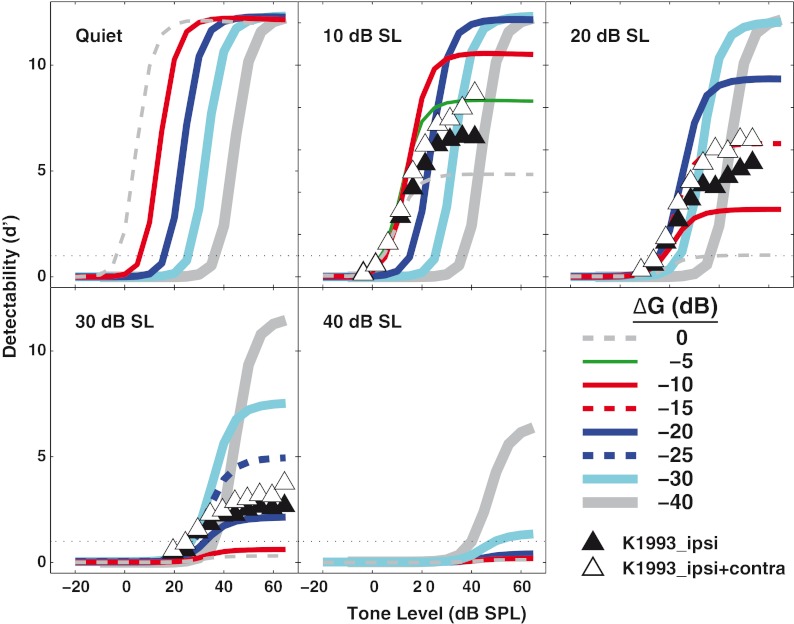
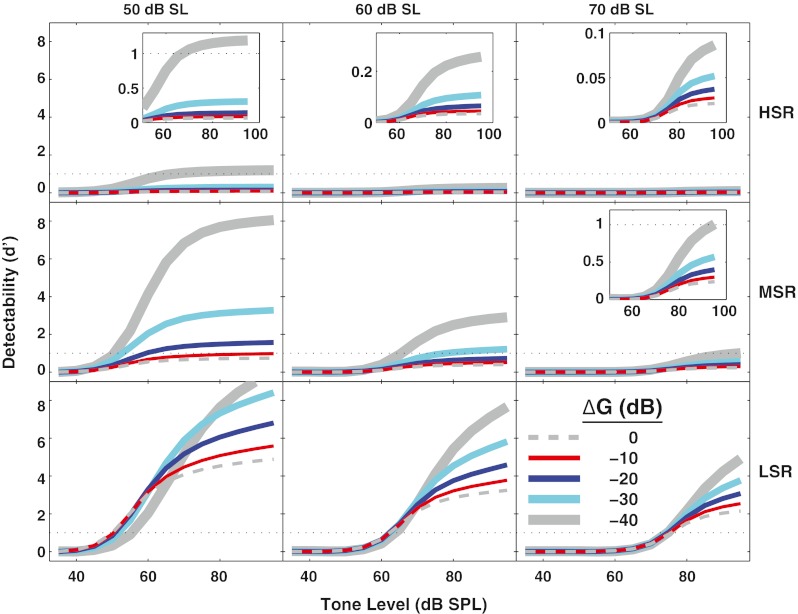
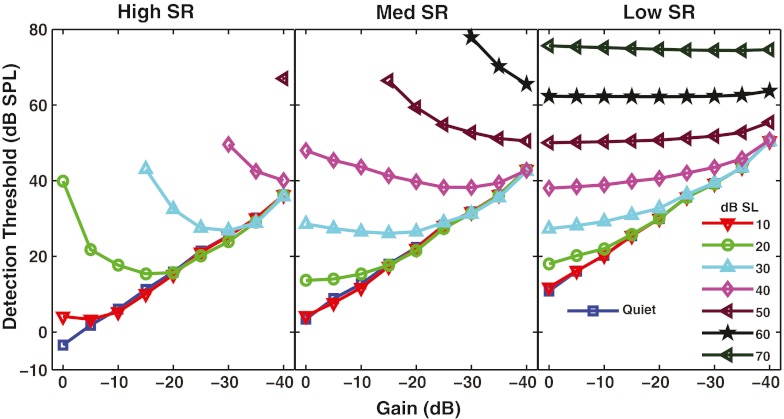
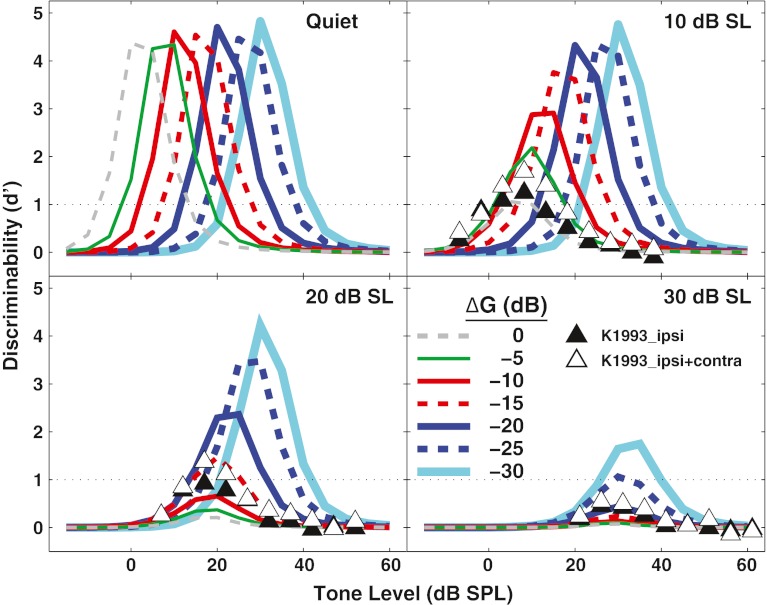
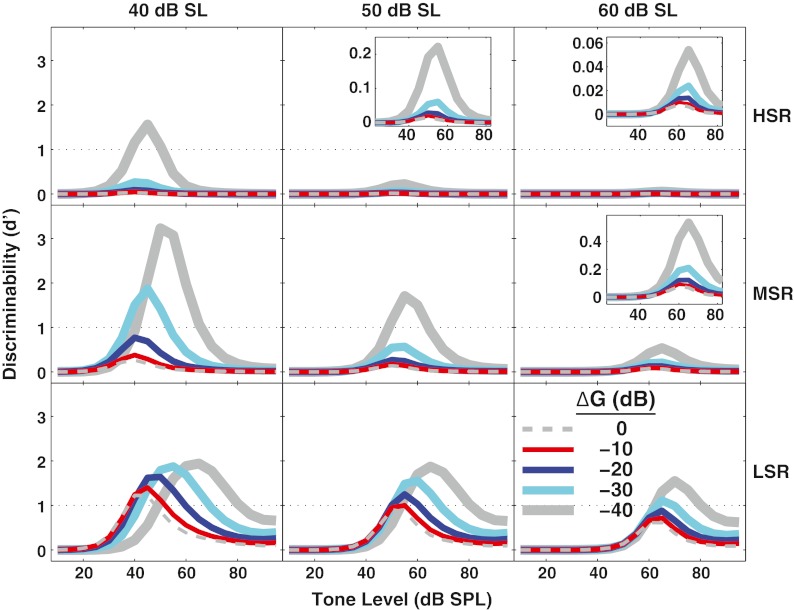
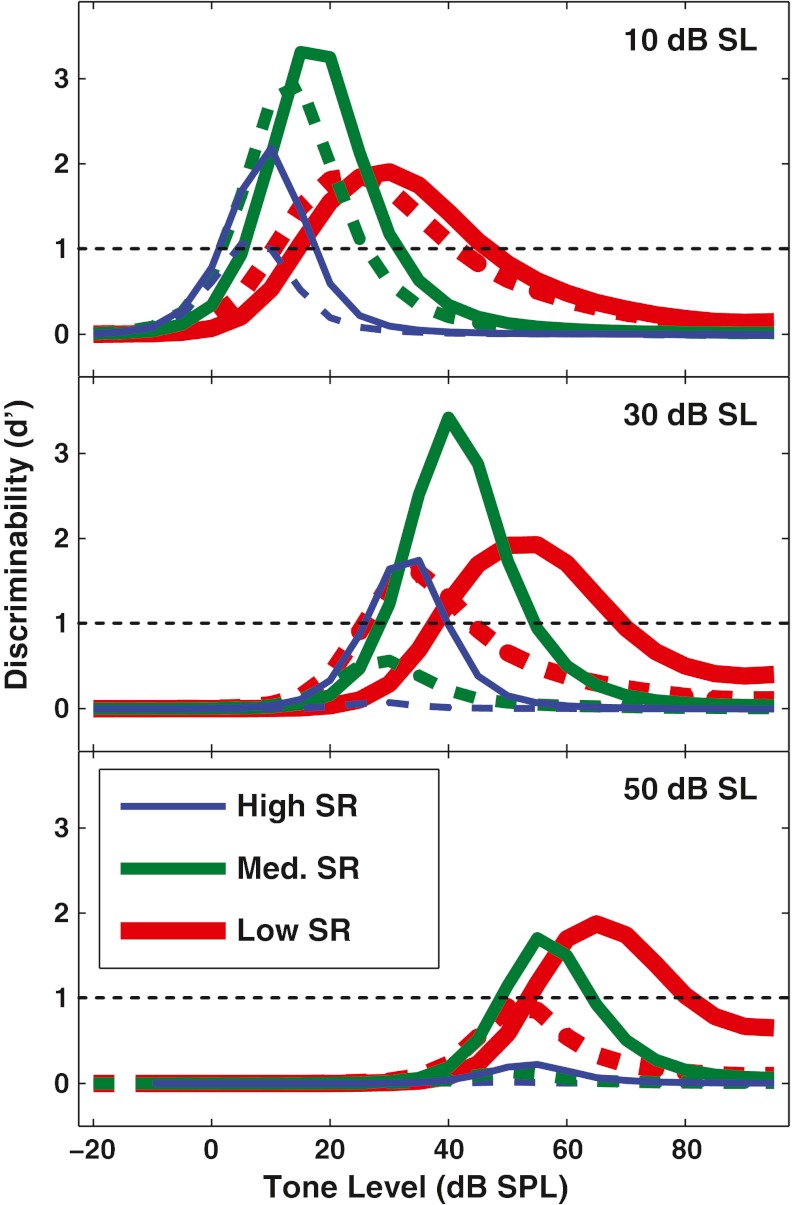
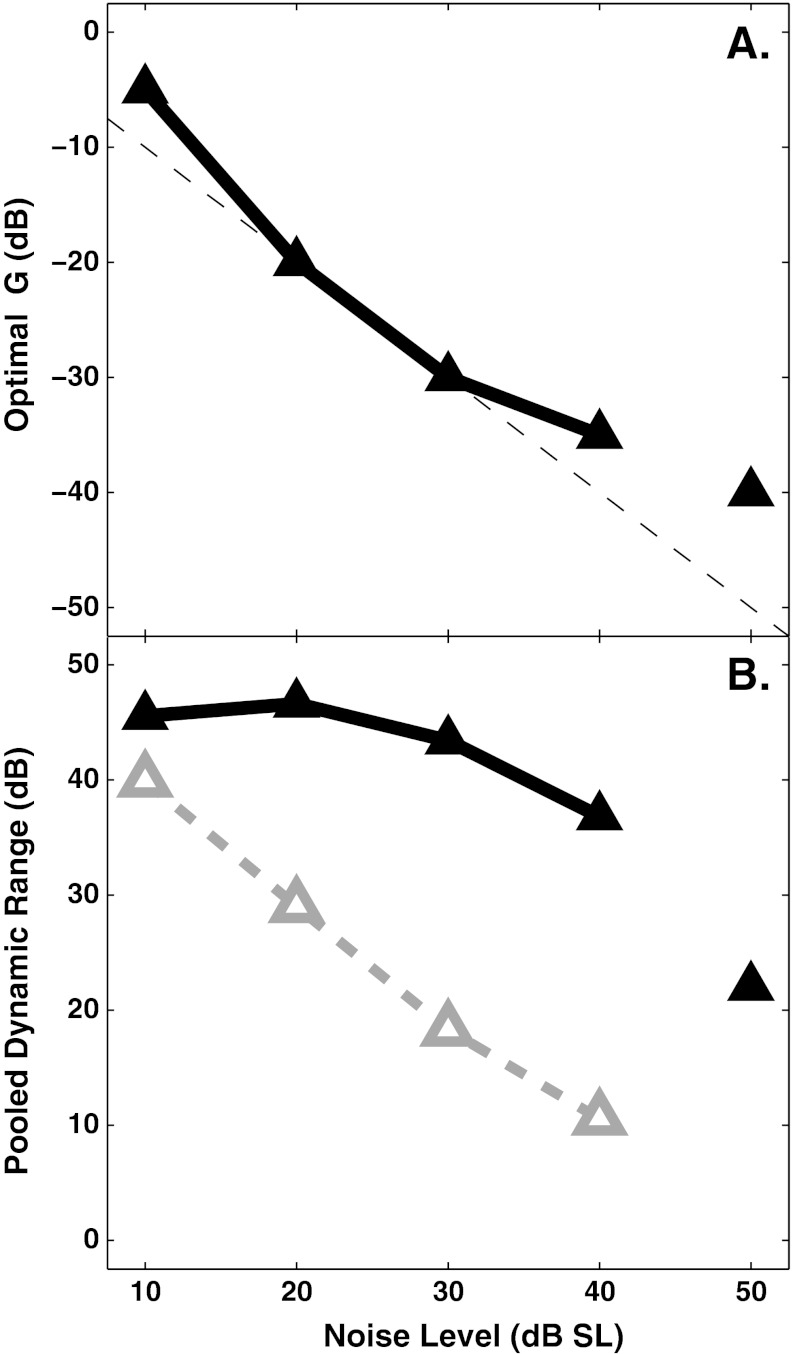
The medial olivocochlear reflex (MOCR) has been hypothesized to provide benefit for listening in noise. Strong physiological support for an anti-masking role for the MOCR has come from the observation that auditory nerve (AN) fibers exhibit reduced firing to sustained noise and increased sensitivity to tones when the MOCR is elicited. The present study extended a well-established computational model for normal-hearing and hearing-impaired AN responses to demonstrate that these anti-masking effects can be accounted for by reducing outer hair cell (OHC) gain, which is a primary effect of the MOCR. Tone responses in noise were examined systematically as a function of tone level, noise level, and OHC gain. Signal detection theory was used to predict detection and discrimination for different spontaneous rate fiber groups. Decreasing OHC gain decreased the sustained noise response and increased maximum discharge rate to the tone, thus modeling the ability of the MOCR to decompress AN fiber rate-level functions. Comparing the present modeling results with previous data from AN fibers in decerebrate cats suggests that the ipsilateral masking noise used in the physiological study may have elicited up to 20 dB of OHC gain reduction in addition to that inferred from the contralateral noise effects. Reducing OHC gain in the model also extended the dynamic range for discrimination over a wide range of background noise levels. For each masker level, an optimal OHC gain reduction was predicted (i.e., where maximum discrimination was achieved without increased detection threshold). These optimal gain reductions increased with masker level and were physiologically realistic. Thus, reducing OHC gain can improve tone-in-noise discrimination even though it may produce a “hearing loss” in quiet. Combining MOCR effects with the sensorineural hearing loss effects already captured by this computational AN model will be beneficial for exploring the implications of their interaction for the difficulties hearing-impaired listeners have in noisy situations.


Figures

FIG. 1
FIG. 1
Schematic diagram of the auditory nerve model. The medial olivocochlear (MOC) reflex was simulated by reducing the gain of the outer hair cells (OHCs) by adjusting the model parameter COHC, as shown by the box marked MOC feedback and the red dashed arrow. Figure modified from Zilany and Bruce (2007) and used with permission from the Journal of the Acoustical Society of America.
FIG. 2
FIG. 2
Schematic of the stimuli and the analysis windows. The noise began at 0 ms. The 50-ms tone burst was presented with an onset at 750 ms. The tone + noise analysis window was the 50-ms during the tone burst. The noise window was the 50-ms window immediately following the tone burst.
FIG. 3
FIG. 3
Outer hair cell (OHC) gain reduction in the AN model can account for medial olivocochlear reflex (MOCR) effects in basilar membrane (BM) responses. Data points are BM input–output functions from guinea pig measured by Russell and Muragasu (, their Fig. 1B). Responses to a tone at the characteristic frequency (CF, 15 kHz) were made without (circles) and with (triangles) shocks to the MOC bundle. The dashed red line is the prediction from the auditory nerve (AN) model at the level of the BM [d(t) in Fig. 1] at a CF of 15 kHz, with full OHC gain. To fit the solid blue line, the COHC parameter of the AN model was varied to find the optimum reduction in gain, which was 15 dB. Model BM output values were scaled by a fixed value (vertical shift) to best match the physiological absolute values in the no-shock condition.
FIG. 4
FIG. 4
Simulated rate-level functions for a high spontaneous rate model neuron with a characteristic frequency (CF) of 8 kHz illustrate that outer hair cell (OHC) gain reduction produced anti-masking effects in single AN fiber responses. The tone frequency is at CF, and it is presented in a noise masker that is at 10 dB SL. Dashed lines are the response to the tone + noise (thicker line) or noise alone immediately following the signal (thinner line). Solid lines show responses to the tone + noise (thicker line) and noise alone (thinner line) when the gain of the OHC module is reduced by the ∆G values shown. The maximum driven rate, shown by the vertical arrows, is the difference between the maximum response to the tone + noise and the response to the noise at low tone levels. The vertical bars at the right of each line are the standard deviation across runs for each condition. Note that the saturated rates for these model responses are somewhat higher than expected for AN fiber responses because they represent the spike rate before the effects of refractoriness (see “Methods” section).
FIG. 5
FIG. 5
Outer hair cell (OHC) gain reduction produced anti-masking effects in all spontaneous rate (SR) groups, with the largest effects for fibers not saturated by the noise alone. Simulated rate-level functions for a high-SR (top row), medium-SR (middle row), and low-SR (bottom row) fiber with a characteristic frequency (CF) of 8 kHz. The tone is at CF; noise is the same level for all SR fibers (50 dB SL re: threshold for the high-SR fiber). Each column represents a different reduction in the OHC gain (∆G). Insets show that there is an effect for high- and medium-SR fibers when the scale is magnified.
FIG. 6
FIG. 6
Decreasing outer hair cell (OHC) gain in the auditory nerve model can improve tone detection in noise. Detectability (d') for a tone in noise is shown for a high spontaneous rate fiber with a characteristic frequency of 8 kHz. The thin dashed lines show the response with full OHC gain (∆G = 0 dB). Lines of increasing thickness show detectability as OHC gain is reduced in 5-dB steps. Increasing noise levels (from 10 to 40 dB SL) are shown across the panels. Filled triangles show data from Kawase et al. (1993) in ipsilateral noise of the same level shown in the panel. Open triangles are Kawase et al. data with the addition of a fixed-level contralateral noise. The horizontal dotted line at d' = 1 is taken to represent detection threshold.
FIG. 7
FIG. 7
Detectability improved with outer hair cell (OHC) gain reduction as in Figure 6, but shown here for all spontaneous rate (SR) groups and for higher noise levels. Detectability (d') for a tone in noise for high-SR (top row), medium-SR (middle row), and low-SR (bottom row) fibers with a characteristic frequency of 8 kHz. Different thicknesses represent different amounts of OHC gain reduction in 10 dB steps. Increasing noise levels (in dB SL) are shown above the panels. Horizontal dotted line (d' = 1) represents detection threshold. Insets with a magnified scale show that the same effects occur (albeit smaller) when fibers are near saturation.
FIG. 8.
FIG. 8.
High spontaneous rate (SR) fibers can aid tone detection in noise when outer hair cell (OHC) gain is reduced by a physiologically realistic amount. Detection threshold is shown as a function of OHC gain reduction. Different noise levels (in decibel sound level) are shown by different symbols (and colors), and fibers with different SRs are shown in the different panels. All fibers had a characteristic frequency of 8 kHz.
FIG. 9
FIG. 9
Decreasing outer hair cell (OHC) gain can improve discrimination in noise and widen the dynamic range for individual auditory nerve fibers. Discriminability (d') for a 5-dB increment in tone level is shown for a high spontaneous rate fiber with a characteristic frequency of 8 kHz. The thin dashed line shows results when the OHC gain is full on (i.e., ∆G = 0 dB, simulating the no-MOCR condition). The solid and dashed lines with increasing thickness show results as OHC gain is decreased to simulate the MOCR. The noise level increases across panels. A d' of 1 was designated as threshold, shown by the horizontal dotted line. Filled and open triangles show physiological data from Kawase et al. (1993) without and with the fixed-level contralateral noise, as in Figure 6.
FIG. 10
FIG. 10
At higher noise levels, outer hair cell gain reduction improves discrimination in all spontaneous rate (SR) groups, with the largest effect for unsaturated low-SR fibers. Discriminability (d') is shown as a function of tone level as in Figure 9, but for all SR groups and for higher noise levels. Noise levels (in dB SL) are shown above the panels. Horizontal dotted line (d' = 1) represents discrimination threshold. Insets with a magnified scale illustrate the same effects occur (although smaller) for fibers near saturation in response to the noise.
FIG. 11
FIG. 11
The dynamic range for discrimination in noise (pooled across all spontaneous rate (SR) groups) increased with outer hair cell (OHC) gain reduction. Discriminability (d') for a 5-dB increment in tone level is plotted as a function of tone level for high-SR (thinnest), medium-SR (medium width), and low-SR (thickest) fibers with a characteristic frequency of 8 kHz. The horizontal dotted line at d' = 1 represents discrimination threshold. Dashed curves show results with no OHC gain reduction, whereas solid curves show results with a single (“optimal”) OHC gain reduction applied to all SR groups. The optimal gain reduction was defined as the decrease in OHC gain that maximized the entire dynamic range (d' ≥ 1) while not shifting the lower end of the range by more than 0.5 dB. The optimal OHC gain reductions were ∆G = 5, 30, and 40 dB for the 10-, 30-, and 50-dB SL noise levels shown across the three rows.
FIG. 12
FIG. 12
Decreasing OHC gain as noise level increases can maintain the dynamic range for discrimination in noise across a wide range of masker levels. Data points at 50 dB are not connected because “optimal” gain could not be estimated precisely due to ΔG being limited to the range between 0 and −40 dB. A The optimal ΔG, in dB, is nearly linearly related to noise level in dB SPL. B The dynamic range (pooled across all spontaneous rate groups, see Fig. 11) is plotted as a function of noise level for conditions with (solid) and without (dashed) OHC gain reduction, i.e., with or without the simulated MOCR.

References

    1. Backus BC, Guinan JJ., Jr Time-course of the human medial olivocochlear reflex. J Acoust Soc Am. 2006;119:2889–2904. doi: 10.1121/1.2169918. - DOI - PubMed
    1. Boyev KP, Liberman MC, Brown MC. Effects of anesthesia on efferent-mediated adaptation of the DPOAE. J Assoc Res Otolaryngol. 2002;3:362–373. doi: 10.1007/s101620020044. - DOI - PMC - PubMed
    1. Brown GJ, Ferry RT, Meddis R. A computer model of auditory efferent suppression: implications for the recognition of speech in noise. J Acoust Soc Am. 2010;127:943–954. doi: 10.1121/1.3273893. - DOI - PubMed
    1. Bruce IC, Sachs MB, Young ED. An auditory-periphery model of the effects of acoustic trauma on auditory nerve responses. J Acoust Soc Am. 2003;113:369–388. doi: 10.1121/1.1519544. - DOI - PubMed
    1. Carney LH. A model for the responses of low-frequency auditory-nerve fibers in cat. J Acoust Soc Am. 1993;93:401–417. doi: 10.1121/1.405620. - DOI - PubMed

Publication types