. 2012 Nov 22;31(47):4898-911.
doi: 10.1038/onc.2011.656. Epub 2012 Jan 30.

Acquired cancer stem cell phenotypes through Oct4-mediated dedifferentiation

Affiliations

Acquired cancer stem cell phenotypes through Oct4-mediated dedifferentiation

S M Kumar et al. Oncogene. .

Abstract

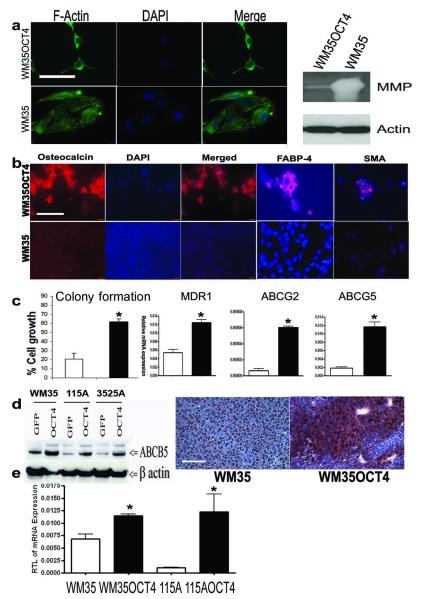
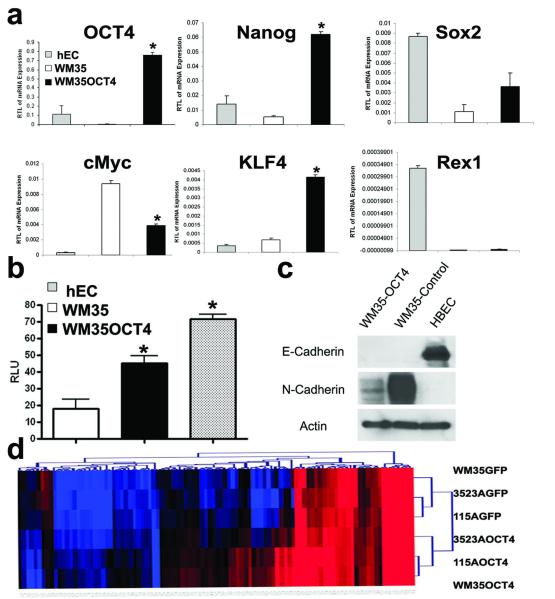
There is enormous interest to target cancer stem cells (CSCs) for clinical treatment because these cells are highly tumorigenic and resistant to chemotherapy. Oct4 is expressed by CSC-like cells in different types of cancer. However, function of Oct4 in tumor cells is unclear. In this study, we showed that expression of Oct4 gene or transmembrane delivery of Oct4 protein promoted dedifferentiation of melanoma cells to CSC-like cells. The dedifferentiated melanoma cells showed significantly decreased expression of melanocytic markers and acquired the ability to form tumor spheroids. They showed markedly increased resistance to chemotherapeutic agents and hypoxic injury. In the subcutaneous xenograft and tail vein injection assays, these cells had significantly increased tumorigenic capacity. The dedifferentiated melanoma cells acquired features associated with CSCs such as multipotent differentiation capacity and expression of melanoma CSC markers such as ABCB5 and CD271. Mechanistically, Oct4-induced dedifferentiation was associated with increased expression of endogenous Oct4, Nanog and Klf4, and global gene expression changes that enriched for transcription factors. RNAi-mediated knockdown of Oct4 in dedifferentiated cells led to diminished CSC phenotypes. Oct4 expression in melanoma was regulated by hypoxia and its expression was detected in a sub-population of melanoma cells in clinical samples. Our data indicate that Oct4 is a positive regulator of tumor dedifferentiation. The results suggest that CSC phenotype is dynamic and may be acquired through dedifferentiation. Oct4-mediated tumor cell dedifferentiation may have an important role during tumor progression.


Figures

Figure 1
Figure 1. Oct4 induced phenotypic changes in vitro
(a) Morphology of WM35GFP (upper left) and WM35OCT4 cells (upper right) in 2% MCDB tumor medium. WM35GFP cells were not able to survival in the hESCM4 medium (lower left) whereas WM35OCT4 cells formed floating spheroids similar to embryoid body (lower right). Representatives image from 5 independent experiments. Bar indicates 100 μm. Western blotting showed levels of Oct4 expression in control and Oct4 infected cells. Human EC cells were used as a positive control and β-actin was used as a loading control. Representative images from 3 replicate experiments. (b) Serially passaged WM35 or WM35OCT4 cells were stained with Oct4 by immunocytochemistry and nuclei with DAPI. Bar indicates 50 μm. (c) Dedifferentiated cells from larger colonies in the soft agar assay. Representative images from 3 replicate experiments. (d) Drug resistance. 1 × 10⁵ tumor cells were seeded in 2% MCDB medium containing 1 μM, 10 μM, or 25 μM cisplatin. Cultured for 24 hours, and cells were stained with trypan blue and counted (n = 3 replicate experiments). * indicates P < 0.05 comparing to control cells. (e) 1 × 10⁴ cells were seeded and then cultured under 1% O2 for 24-72 hours (n = 3 replicate experiments). Cell proliferation was assessed by WTT assay. * indicates P < 0.05 comparing experimental to control cells. The data represent mean ± s.e.m values.
Figure 2
Figure 2. Oct4 induced Increase in tumorigenecity in vivo
(a) Two million WM35GFP or WM35OCT4 cells were injected subcutaneously in the flanks of NOD/SCID/IL-γ mice (n = 6) and these mice were followed for 5 weeks. Representative primary xenografts were shown in the left and average tumor weight was shown in the right. Bar indicates 1 cm. * indicates P < 0.05. (b) Hemotoxylin and Eosin (H & E) stain and immunohistochemical stains for Oct4 and Melan-A. Bar in low power view indicates 200 μm, and Bar in high power indicates 40 μm. (c) The dedifferentiated tumor cells expressed markers for Endoderm (CDX2), Mesoderm (HHF35) and Ectoderm (PanCK and neurofilament). Bar indicates 40 μm. (d) 100K cells were isolated from the primary xenografts and directly inject subcutaneously to the flanks of naïve NOD/SCID/IL-γ mice (n = 6) to form secondary tumors. Average secondary tumor weight is shown (*P < 0.05). (e) 100K tumor cells were injected via tail vein of NOD/SCID/IL-γ mice (n = 5) and these mice were followed for 12 weeks. Representative histology of lung in mice received either WM35 or WM35OCT4 cells. All the 5 mice that received WM35OCT4 cells developed tumors in the lung (right panel). Arrows point to the tumor. Bar indicates 200 μm. The data represent mean ± s.e.m values.
Figure 3
Figure 3. Acquired CSC-like phenotypes
(a) F-actin polymerization in WM35 cells resulted in cell membrane protrusion and migration activity, whereas WM35OCT4 cells did not show any membrane protrusion. Nuclei were stained with DAPI. Bar indicates 40 μm. Secretion of MMP2 from WM35 and WM35OCT4 was examined using MMP2 in-gel gelatin zymography. Actin from cell lysate was used as loading control. (b) Multipotent differentiation. DAPI is used to visualize nuclei. Immunocytochemistry for Osteocalcin, FABP-4 and SMA was performed. Representative images from 3 replicate experiments. Bar indicates 40 μm. (c) Limiting dilution assays were performed to assess self-renewal capacity. The number of colonies formed was counted and averaged in 3 replicate experiments (*P < 0.01). Real time quantitative PCR was performed to access the expression of MDR1, ABCG2 and ABCG5 (n = 3 replicates)(*P < 0.01). (d) Western blot showed increased ABCB5 expression in WM35, 115A and 3525A cells after dedifferentiation. Bar indicates 100 μm. (e) Real time quantitative PCR was performed for CD271 (n = 3 replicates) (*P < 0.01). The data represent mean ± s.e.m values.
Figure 4
Figure 4. Mechanisms underlying Oct4 induced dedifferentiation
(a) Quantitative RT-PCR was performed for Oct4, Nanog, Sox2, cMyc, KLF4 and Rex1 (n = 3 replicate experiments) and showed significant increase of Oct4, Nanog and KLF4 (*P < 0.01). Human EC cells were used as a control. (b) Oct4 promoter luciferase reporter assay (n = 3 replicate experiments). *P < 0.05 comparing WM35OCT4 vs WM35. hEC was used as positive control. (c) Cadherin expression. Western blot analysis of E- and N-Cadherin expression after Oct4 infection. WM35 and WM35OCT4 cells did not express E-Cadherin, and there was down regulation of N-Cadherin in WM35OCT4 cells. Human bronchial epithelial cells were used as controls. (d) Global gene expression profiling was performed. An unsupervised cluster analysis using the top 100 probes significantly changed after dedifferentiation.
Figure 5
Figure 5. Oct4 knockdown decreases CSC phenotypes
(a) Dedifferentiated WM35 cells were infected with lentiviruses carrying Oct4 shRNA. Western blot showed decreased Oct4 expression after knockdown. (b) Oct4 knockdown resulted in decreased colony size. Representative images from 3 replicate experiments. The Oct4 shRNA vector had a GFP tag. The knockdown cells showed green fluorescence (insert). (c) WM35OCT4 cells with Oct4 shRNA showed decreased growth rate comparing to WM35OCT4 cells under normoxia (n = 3 replicate experiments). * indicates P < 0.05. (d) WM35OCT4 cells with Oct4 shRNA showed decreased tolerance to hypoxia (1% O2, n = 3 replicate experiments). * indicates P < 0.01; however, these cells still grew faster than WM35. (e) WM35OCT4 cells with Oct4 shRNA showed decreased resistance to cisplatin (n = 3 replicate experiments), however these cells were still more resistant to the drug than the original WM35 cells (#P < 0.05 comparing to WM35OCT4 with Oct4 shRNA, *P < 0.05 comparing to the original WM35 with scramble shRNA). The data represent mean ± s.e.m values.
Figure 6
Figure 6. Transmembrane Oct4 protein induces dedifferentiation
(a) The cell membrane permeable PTD-OCT4 protein with a His-tag was used to transduce WM35 cells 4 times in a 10 day period. The presence of exogenous protein was detected by anti-His-tag antibody, and expression of Oct4 was also evident 4 days after the last treatment. Bars indicate 40 μm. (b) The tumor cells started to form spheres 2 weeks after the last treatment. Arrows points to the spheres. Representatives image from 3 independent experiments. (c) The sphere forming cells expression significantly lower levels of Mitf and tyrosinase gene than normal melanocytes and control WM35 (n= 3 replicates, *P < 0.01). (d) Quantitative RT PCR was performed and showed that Oct4, Nanog and Klf-4 expression levels in dedifferentiated cells were similar or higher than in hEC cells. hEC cells were used as a positive control (n = 3 replicate, *P < 0.05). WM35 express little of these stemness genes. (e) The Oct4-protein-dedifferentiated cells were more resistant to cisplatin (n = 3 replicate experiments) (*P < 0.01). The data represent mean ± s.e.m values.
Figure 7
Figure 7. Regulation of Oct4 by hypoxia and Oct4 expression in melanoma tissues
(a) Hypoxia increases Oct4 gene expression. Quantitative RT-PCR showed that hypoxia (1% O2) significantly increased Oct4 gene expression (n = 3) (*p < 0.01). NX: normoxia, HX: hypoxia. (b) Hypoxia increases Oct4 protein expression. Oct4 protein expression was measured by western blot analysis. NX: normoxia, HX: hypoxia. (c) Expression of Oct4 mRNA in melanoma tissues. Four of five fresh melanoma tissues expressed Oct4. (d) Immnohistochemical stains of Oct4 in human melanoma tissue. Oct4 showed nuclear staining pattern. Nuclei of some melanoma cells were highlighted. Bar indicates 80 μm in the left panel and 20μm in the right panel.

References

    1. Ben-Porath I, Thomson MW, Carey VJ, Ge R, Bell GW, Regev A, Weinberg RA. An embryonic stem cell-like gene expression signature in poorly differentiated aggressive human tumors. Nat Genet. 2008;40:499–507. - PMC - PubMed
    1. Bennett DC. Differentiation in mouse melanoma cells: initial reversibility and an on-off stochastic model. Cell. 1983;34:445–453. - PubMed
    1. Boiko AD, Razorenova OV, van de RM, Swetter SM, Johnson DL, Ly DP, et al. Human melanoma-initiating cells express neural crest nerve growth factor receptor CD271. Nature. 2010;466:133–137. - PMC - PubMed
    1. Chan EM, Ratanasirintrawoot S, Park IH, Manos PD, Loh YH, Huo H, et al. Live cell imaging distinguishes bona fide human iPS cells from partially reprogrammed cells. Nat Biotechnol. 2009;27:1033–1037. - PubMed
    1. Chen Y, Shi L, Zhang L, Li R, Liang J, Yu W, Sun L, Yang X, Wang Y, et al. The molecular mechanism governing the oncogenic potential of SOX2 in breast cancer. J Biol Chem. 2008;283:17969–17978. - PubMed

Publication types

MeSH terms