. 2012 Apr;22(4):714-20.
doi: 10.1101/gr.132647.111. Epub 2012 Jan 27.

Evolutionary rate covariation reveals shared functionality and coexpression of genes

Affiliations

Evolutionary rate covariation reveals shared functionality and coexpression of genes

Nathan L Clark et al. Genome Res. 2012 Apr.

Abstract

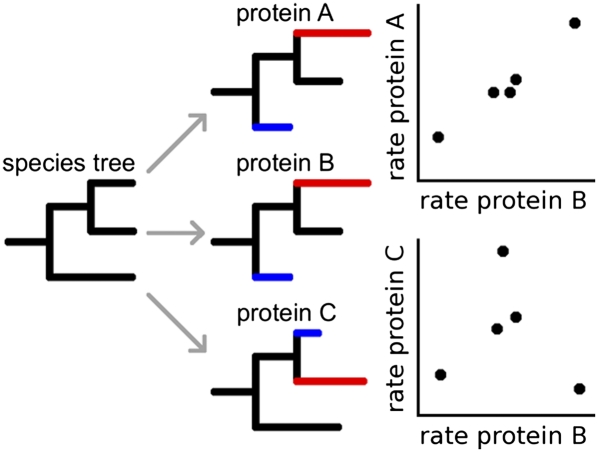
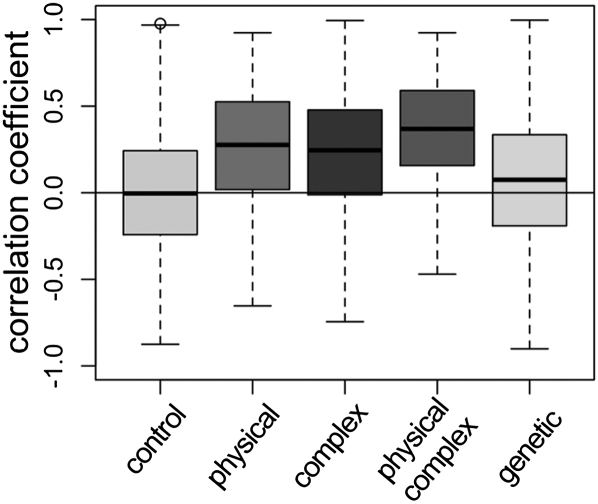
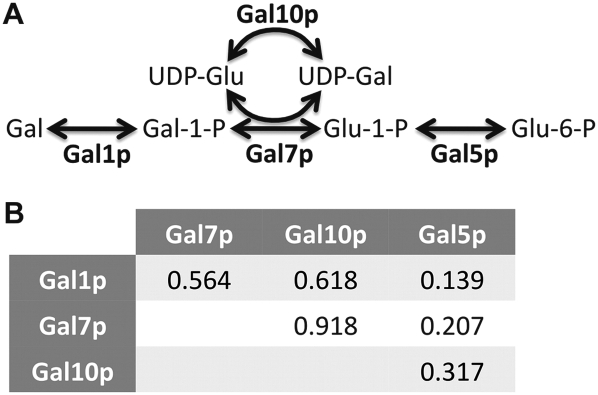
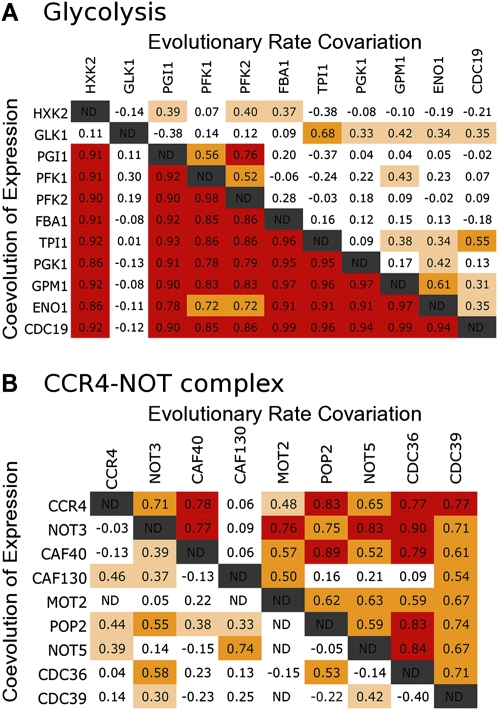
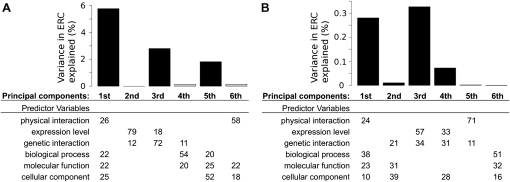
Evolutionary rate covariation (ERC) is a phylogenetic signature that reflects the covariation of a pair of proteins over evolutionary time. ERC is typically elevated between interacting proteins and so is a promising signature to characterize molecular and functional interactions across the genome. ERC is often assumed to result from compensatory changes at interaction interfaces (i.e., intermolecular coevolution); however, its origin is still unclear and is likely to be complex. Here, we determine the biological factors responsible for ERC in a proteome-wide data set of 4459 proteins in 18 budding yeast species. We show that direct physical interaction is not required to produce ERC, because we observe strong correlations between noninteracting but cofunctional enzymes. We also demonstrate that ERC is uniformly distributed along the protein primary sequence, suggesting that intermolecular coevolution is not generally responsible for ERC between physically interacting proteins. Using multivariate analysis, we show that a pair of proteins is likely to exhibit ERC if they share a biological function or if their expression levels coevolve between species. Thus, ERC indicates shared function and coexpression of protein pairs and not necessarily coevolution between sites, as has been assumed in previous studies. This full interpretation of ERC now provides us with a powerful tool to assign uncharacterized proteins to functional groups and to determine the interconnectedness between entire genetic pathways.


Figures

Figure 1.
Figure 1.
Parallel change in evolutionary rate leads to rate covariation. Most proteins encoded in a genome evolve over the same species tree and so have evolved for the same amount of chronological time over each branch. Yet individual proteins experience varying rates of sequence evolution over those same branches. Hypothetical protein “A” experienced rapid evolution in one species lineage (red branch) and an exceptionally slow rate of evolution in another (blue branch). Another protein “B” experienced very similar rate variation during the evolution of these species, so that its branch rates are positively correlated with the rates of protein A (upper plot). Their evolutionary rate covariation suggests a relationship between A and B. Another protein, “C,” also experienced acceleration and deceleration, but its evolutionary pattern did not result in ERC with protein B (lower plot). Note that the values in these plots are rates of sequence evolution normalized to the expected rate given the species tree.
Figure 2.
Figure 2.
ERC is elevated between functionally related proteins. Here, we contrast ERC between protein pairs that: (left to right) have no annotated relationship (control), physically interact, are in the same complex, physically interact and are in the same complex, and genetically interact. All classes are significantly different from the control class (Wilcoxon rank sum test, P < 2.2 × 10⁻¹⁶). The box limits are the upper and lower quartiles of each distribution, while the bold line represents the median. Whiskers extend to the most extreme data point outside the box that is no more than 1.5 times the interquartile range.
Figure 3.
Figure 3.
Galactose enzymes exhibit ERC. The classic galactose metabolic pathway (A) converts galactose (Gal) into glucose 6-phosphate (Glu-6-P) via four enzymes: Gal1p, Gal7p, Gal10p, and Gal5p. A pairwise comparison table (B) shows the strength of ERC (correlation coefficient) between each protein pair. RVC between Gal1p, Gal7p, and Gal10p is notably elevated, while that with Gal5p is less elevated but also positive. ERC between Gal7p and Gal10p is the highest value proteome-wide for both proteins.
Figure 4.
Figure 4.
ERC and coevolution of expression are not coincidental. Pairwise correlation matrices show values of ERC (above diagonal) and coevolution of expression level (below diagonal) between glycolysis (A) and CCR4-NOT complex (B) proteins. Both ERC and expression coevolution are significantly elevated for both sets of proteins (P < 0.01). However, ERC is much stronger than expression coevolution in the CCR4-NOT complex, while it is the opposite case between glycolysis proteins. (Red) Values greater than 0.75; (orange) values between 0.5 and 0.75; (beige) values between 0.3 and 0.5.
Figure 5.
Figure 5.
Multivariate analysis reveals biological variables associated with ERC. Two principal components regressions were performed: one on nuclear pore and DNA repair proteins (A) and the second on a larger 982-protein data set (B). The predictor variables (rows) were broken into six principal components (columns). Table values are the percentage of each predictor variable composing a principal component. For visual clarity, values <10% are not displayed. Each component was regressed against ERC to determine its individual contribution, and the bar above a component shows the percent of ERC variance explained. Components significantly associated with ERC have black bars (P < 0.01).

References

    1. Ashburner M, Ball CA, Blake JA, Botstein D, Butler H, Cherry JM, Davis AP, Dolinski K, Dwight SS, Eppig JT, et al. 2000. Gene ontology: tool for the unification of biology. The Gene Ontology Consortium. Nat Genet 25: 25–29 - PMC - PubMed
    1. Bennetzen JL, Hall BD 1982. Codon selection in yeast. J Biol Chem 257: 3026–3031 - PubMed
    1. Clark NL, Aquadro CF 2010. A novel method to detect proteins evolving at correlated rates: identifying new functional relationships between coevolving proteins. Mol Biol Evol 27: 1152–1161 - PMC - PubMed
    1. Clark NL, Gasper J, Sekino M, Springer SA, Aquadro CF, Swanson WJ 2009. Coevolution of interacting fertilization proteins. PLoS Genet 5: e1000570 doi: 10.1371/journal.pgen.1000570 - PMC - PubMed
    1. De Robichon-Szulmajster H 1958. Induction of enzymes of the galactose pathway in mutants of Saccharomyces cerevisiae. Science 127: 28–29 - PubMed

Publication types

LinkOut - more resources