Retrotransposon profiling of RNA polymerase III initiation sites
- PMID: 22287102
- PMCID: PMC3317150
- DOI: 10.1101/gr.131219.111
Retrotransposon profiling of RNA polymerase III initiation sites
Abstract
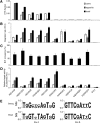
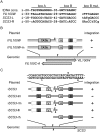
Although retroviruses are relatively promiscuous in choice of integration sites, retrotransposons can display marked integration specificity. In yeast and slime mold, some retrotransposons are associated with tRNA genes (tDNAs). In the Saccharomyces cerevisiae genome, the long terminal repeat retrotransposon Ty3 is found at RNA polymerase III (Pol III) transcription start sites of tDNAs. Ty1, 2, and 4 elements also cluster in the upstream regions of these genes. To determine the extent to which other Pol III-transcribed genes serve as genomic targets for Ty3, a set of 10,000 Ty3 genomic retrotranspositions were mapped using high-throughput DNA sequencing. Integrations occurred at all known tDNAs, two tDNA relics (iYGR033c and ZOD1), and six non-tDNA, Pol III-transcribed types of genes (RDN5, SNR6, SNR52, RPR1, RNA170, and SCR1). Previous work in vitro demonstrated that the Pol III transcription factor (TF) IIIB is important for Ty3 targeting. However, seven loci that bind the TFIIIB loader, TFIIIC, were not targeted, underscoring the unexplained absence of TFIIIB at those sites. Ty3 integrations also occurred in two open reading frames not previously associated with Pol III transcription, suggesting the existence of a small number of additional sites in the yeast genome that interact with Pol III transcription complexes.
Figures


Similar articles
-
Local features determine Ty3 targeting frequency at RNA polymerase III transcription start sites.Genome Res. 2019 Aug;29(8):1298-1309. doi: 10.1101/gr.240861.118. Epub 2019 Jun 27. Genome Res. 2019. PMID: 31249062 Free PMC article.
-
Retrotransposon Ty1 integration targets specifically positioned asymmetric nucleosomal DNA segments in tRNA hotspots.Genome Res. 2012 Apr;22(4):693-703. doi: 10.1101/gr.129460.111. Epub 2012 Jan 4. Genome Res. 2012. PMID: 22219510 Free PMC article.
-
A nucleosomal surface defines an integration hotspot for the Saccharomyces cerevisiae Ty1 retrotransposon.Genome Res. 2012 Apr;22(4):704-13. doi: 10.1101/gr.129585.111. Epub 2012 Jan 4. Genome Res. 2012. PMID: 22219511 Free PMC article.
-
Regulation of tRNA synthesis by the general transcription factors of RNA polymerase III - TFIIIB and TFIIIC, and by the MAF1 protein.Biochim Biophys Acta Gene Regul Mech. 2018 Apr;1861(4):320-329. doi: 10.1016/j.bbagrm.2018.01.011. Epub 2018 Feb 6. Biochim Biophys Acta Gene Regul Mech. 2018. PMID: 29378333 Review.
-
Light and shadow on the mechanisms of integration site selection in yeast Ty retrotransposon families.Curr Genet. 2021 Jun;67(3):347-357. doi: 10.1007/s00294-021-01154-7. Epub 2021 Feb 15. Curr Genet. 2021. PMID: 33590295 Review.
Cited by
-
Reproducible evaluation of transposable element detectors with McClintock 2 guides accurate inference of Ty insertion patterns in yeast.bioRxiv [Preprint]. 2023 Mar 21:2023.02.13.528343. doi: 10.1101/2023.02.13.528343. bioRxiv. 2023. Update in: Mob DNA. 2023 Jul 14;14(1):8. doi: 10.1186/s13100-023-00296-4. PMID: 36824955 Free PMC article. Updated. Preprint.
-
Local features determine Ty3 targeting frequency at RNA polymerase III transcription start sites.Genome Res. 2019 Aug;29(8):1298-1309. doi: 10.1101/gr.240861.118. Epub 2019 Jun 27. Genome Res. 2019. PMID: 31249062 Free PMC article.
-
A long terminal repeat retrotransposon of Schizosaccharomyces japonicus integrates upstream of RNA pol III transcribed genes.Mob DNA. 2015 Oct 9;6:19. doi: 10.1186/s13100-015-0048-2. eCollection 2015. Mob DNA. 2015. PMID: 26457121 Free PMC article.
-
RNA Polymerase III Advances: Structural and tRNA Functional Views.Trends Biochem Sci. 2016 Jun;41(6):546-559. doi: 10.1016/j.tibs.2016.03.003. Epub 2016 Apr 8. Trends Biochem Sci. 2016. PMID: 27068803 Free PMC article. Review.
-
Archetypal transcriptional blocks underpin yeast gene regulation in response to changes in growth conditions.Sci Rep. 2018 May 21;8(1):7949. doi: 10.1038/s41598-018-26170-5. Sci Rep. 2018. PMID: 29785040 Free PMC article.
References
-
- Alekseyenko AV, Lee CJ 2007. Nested Containment List (NCList): A new algorithm for accelerating interval query of genome alignment and interval databases. Bioinformatics 23: 1386–1393 - PubMed
-
- Amberg DC, Burke DJ, Strathern JN 2005. Methods in yeast genetics. Cold Spring Harbor Laboratory Press, Cold Spring Harbor, NY
-
- Ausubel FM, Brent R, Kingston RE, Moore DD, Seidman JG, Smith JA, Struhl K 2007. Current protocols in molecular biology. Wiley, New York
Publication types
MeSH terms
Substances
Associated data
- Actions
Grants and funding
LinkOut - more resources
Full Text Sources
Molecular Biology Databases
Miscellaneous
