. 2012 Apr;22(4):666-80.
doi: 10.1101/gr.130286.111. Epub 2012 Jan 27.

A multiplicity of factors contributes to selective RNA polymerase III occupancy of a subset of RNA polymerase III genes in mouse liver

Collaborators, Affiliations

A multiplicity of factors contributes to selective RNA polymerase III occupancy of a subset of RNA polymerase III genes in mouse liver

Donatella Canella et al. Genome Res. 2012 Apr.

Abstract

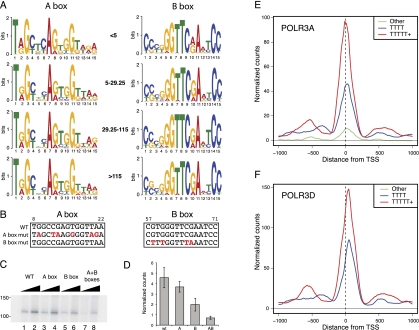
The genomic loci occupied by RNA polymerase (RNAP) III have been characterized in human culture cells by genome-wide chromatin immunoprecipitations, followed by deep sequencing (ChIP-seq). These studies have shown that only ∼40% of the annotated 622 human tRNA genes and pseudogenes are occupied by RNAP-III, and that these genes are often in open chromatin regions rich in active RNAP-II transcription units. We have used ChIP-seq to characterize RNAP-III-occupied loci in a differentiated tissue, the mouse liver. Our studies define the mouse liver RNAP-III-occupied loci including a conserved mammalian interspersed repeat (MIR) as a potential regulator of an RNAP-III subunit-encoding gene. They reveal that synteny relationships can be established between a number of human and mouse RNAP-III genes, and that the expression levels of these genes are significantly linked. They establish that variations within the A and B promoter boxes, as well as the strength of the terminator sequence, can strongly affect RNAP-III occupancy of tRNA genes. They reveal correlations with various genomic features that explain the observed variation of 81% of tRNA scores. In mouse liver, loci represented in the NCBI37/mm9 genome assembly that are clearly occupied by RNAP-III comprise 50 Rn5s (5S RNA) genes, 14 known non-tRNA RNAP-III genes, nine Rn4.5s (4.5S RNA) genes, and 29 SINEs. Moreover, out of the 433 annotated tRNA genes, half are occupied by RNAP-III. Transfer RNA gene expression levels reflect both an underlying genomic organization conserved in dividing human culture cells and resting mouse liver cells, and the particular promoter and terminator strengths of individual genes.


Figures

Figure 1.
Figure 1.
Identification of RNAP-III-occupied loci in mouse liver. (A) The pie chart summarizes the RNAP-III-occupied genomic regions in the mouse liver as determined by peak detection (Canella et al. 2010; see also Methods). The “other RNAP-III genes” category contains the known RNAP-III genes other than tRNA, Rn5s, and Rn4.5s (listed in Supplemental Table S3). (B) Pearson correlations of linear scores obtained with the anti-POLR3A and anti-POLR3D antibodies for the rep1 and rep2 biological replicates, as indicated. All loci listed in Supplemental Tables S1–S5 are included. The regression line is indicated in red, the y = x line in blue. The Pearson correlation coefficients are indicated in the squares in the top right. (C) UCSC browser views showing POLR3A and POLR3D peaks on a tRNA gene (n-Tr6, chr14, tRNA209-ArgACG), a Rnu6atac gene, a Rn4.5s gene, and a Rn5s gene. (D) The POLR3A and POLR3D peaks are offset relative to one another. The shift between the POLR3A and POLR3D peak summits (in a region from −30 to +70 around the TSS) for all tRNA genes with scores above 29.25 is shown on the x-axis, with the frequency on the y-axis. The mean and median shift values are indicated, together with the confidence interval (computed by the bootstrap method at 95% confidence interval).
Figure 2.
Figure 2.
(A) Arrangement of RNAP-III genes in shared syntenic regions containing the Polr3e gene in the mouse and human genomes. The last four numbers of the chromosome coordinates are indicated below the lines. (B) Alignment of the mouse (Mus musculus, Mm) and human (Hs) MIR sequences. The region where RNAP-III transcription is likely to initiate and the terminator region are highlighted in red. Similarities to A- and B-box elements are indicated in bold. Identities are labeled with asterisks. (C) View of the tags obtained in the ChIPs performed with antibodies against the factors indicated on the left. The accumulations of + and − tags are shown above and below the lines, respectively. The location of the first exon and intron of the Polr3e gene is shown at top, that of the tRNA Leucine and the MIR at the bottom. (D) Zoom-in of the region around the Polr3e transcription start site.
Figure 3.
Figure 3.
Average tag density profiles for RNAP-II and RNAP-III subunits and some histone marks. Two hundred and six tRNA genes (117 with scores <5; 26 with scores between 5 and 29.25; 28 with scores between 29.26 and 115.37; 35 with scores >115.37) removed by at least 1000 bp from the nearest RNAP-III or mRNA-encoding RNAP-II transcription unit were selected for this analysis. An analysis with genes removed by at least 1000 bp from RNAP-III and all RNAP-II transcription units including those encoding noncoding RNAs gave identical results (159 genes, 83 with scores <5; 23 with scores between 5 and 29.25; 24 with scores between 29.26 and 115.37; 29 with scores >115.37; data not shown). (A) Average tag density profile for the factors indicated on all 206 genes. (B–E,G) average tag profile for the indicated factors on genes with RNAP-III scores smaller than 5, between 5 and 29.25, between 29.25 and 115.37, and larger than 115.37, as indicated. (F) Average POLR2B tag profile on RNAP-III TSS (dotted line) and, for comparison, on RNAP-II TSS divided into quartiles with the lowest (first quartile) to the highest (fourth quartile) level of RNAP-II indicated by lines of darkening shades of green. (H–J) Tag profile for POLR3A, POLR3D, and H3K4me3, as indicated, on 206 isolated tRNA genes divided according to the percentage of CpG dinucleotides (in a region extending from 300 nt upstream of the TSS to 100 nt downstream from the RNA coding region).
Figure 4.
Figure 4.
RNAP-III-occupied tRNA genes are often close to transcribed RNAP-II genes. (A) RNAP-III-occupied tRNA genes are often close to RNAP-II TSSs. The horizontal axis shows the distance separating RNAP-III and RNAP-II TSSs (0 indicates the RNAP-III TSS; negative and positive numbers indicate the regions upstream of and downstream from the TSS, respectively). The vertical axis indicates the number of tRNA genes in bins of 100 bp, separated into genes with RNAP-III occupancy scores >29.25 (red) and <29.25 (blue). (B,C) As in A, but only the RNAP-II genes transcribed in the same or opposite strand, respectively, as the tRNA gene are shown. (D) Box plots show tRNA genes with scores <5 (blue box), between 5 and 29.25 (dark blue box), between 29.26 and 115.37 (bright red box), and higher than 115.37 (dark red box). (Vertical axis) Highest number of POLR2B tags in 500-bp regions centered on an RNAP-II TSS found within 5 kb upstream of and 5 kb downstream from each tRNA gene.
Figure 5.
Figure 5.
The qualities of the A and B box and terminator sequences correlate with RNAP-III occupancy. (A) The LOGOs obtained for the A and B boxes in tRNA genes with the RNAP-III scores indicated in the middle. (B) A and B box mutations introduced into the serine tRNA gene (chr11_1821_tRNASer_GCT-). Note that bases 3–6, 14, and 15 of the A box, and bases 2–6, 14, and 15 of the B box are, for most tRNAs, involved in base-pairing in the clover leaf structure. For the tRNA gene analyzed here, the bases involved in base-pairing are bases 3–5 of the A box and bases 2–6, 14, and 15 of the B box. (C) In vitro transcription with the serine tRNA gene, either wild type, or with mutations in the A, B, or both A and B boxes as indicated above the lanes. (D) Quantitation of six replicate experiments as in C. (E) Average tag density profiles for POLR3A in genes with strong terminators (5Ts or more, red line), medium terminators (4Ts, blue line), or poor terminators (less than 4Ts, green line). (F) As in E, but for POLR3D.

Similar articles

Cited by

References

    1. Altman S, Wesolowski D, Puranam RS 1993. Nucleotide sequences of the RNA subunit of RNase P from several mammals. Genomics 18: 418–422 - PubMed
    1. Ame JC, Schreiber V, Fraulob V, Dolle P, de Murcia G, Niedergang CP 2001. A bidirectional promoter connects the poly(ADP-ribose) polymerase 2 (PARP-2) gene to the gene for RNase P RNA. Structure and expression of the mouse PARP-2 gene. J Biol Chem 276: 11092–11099 - PubMed
    1. Anzai K, Kobayashi S, Kitamura N, Kanai Y, Nakajima H, Suehiro Y, Goto S 1986. Isolation and sequencing of a genomic clone for mouse brain specific small RNA. J Neurochem 47: 673–677 - PubMed
    1. Barski A, Cuddapah S, Cui K, Roh TY, Schones DE, Wang Z, Wei G, Chepelev I, Zhao K 2007. High-resolution profiling of histone methylations in the human genome. Cell 129: 823–837 - PubMed
    1. Barski A, Chepelev I, Liko D, Cuddapah S, Fleming AB, Birch J, Cui K, White RJ, Zhao K 2010. Pol II and its associated epigenetic marks are present at Pol III-transcribed noncoding RNA genes. Nat Struct Mol Biol 17: 629–634 - PMC - PubMed

Publication types

Associated data