

Improved MR-based characterization of engineered cartilage using multiexponential T2 relaxation and multivariate analysis
- PMID: 22287335
- PMCID: PMC3366280
- DOI: 10.1002/nbm.1804
Improved MR-based characterization of engineered cartilage using multiexponential T2 relaxation and multivariate analysis
Abstract
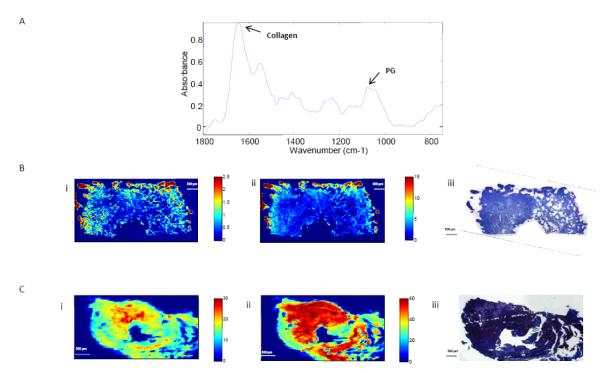
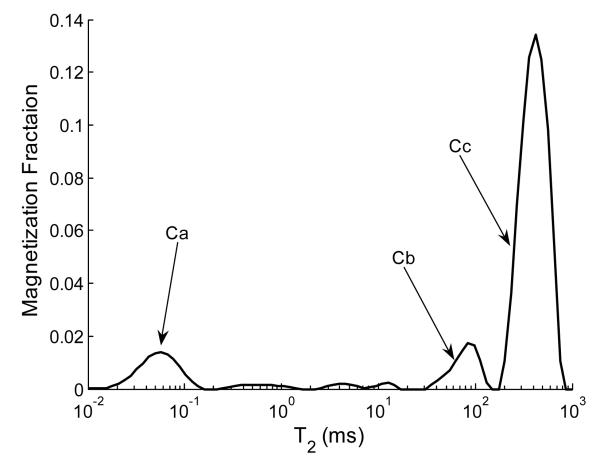
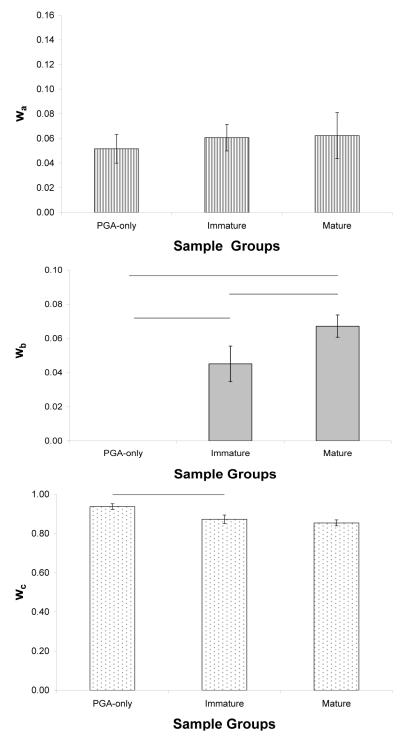
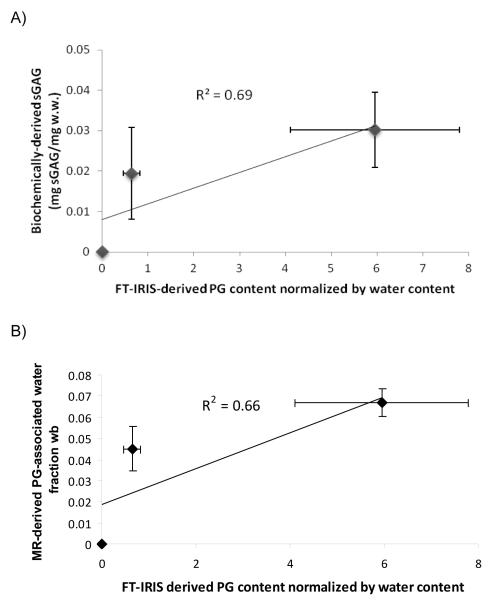
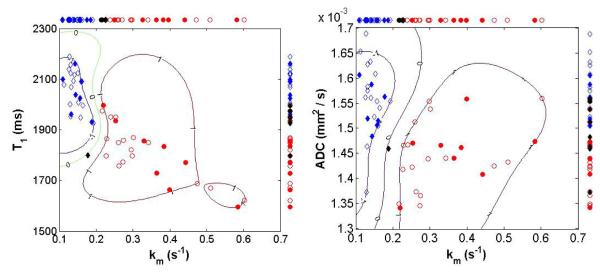
Noninvasive monitoring of tissue quality would be of substantial use in the development of cartilage tissue engineering strategies. Conventional MR parameters provide noninvasive measures of biophysical tissue properties and are sensitive to changes in matrix development, but do not clearly distinguish between groups with different levels of matrix development. Furthermore, MR outcomes are nonspecific, with particular changes in matrix components resulting in changes in multiple MR parameters. To address these limitations, we present two new approaches for the evaluation of tissue engineered constructs using MR, and apply them to immature and mature engineered cartilage after 1 and 5 weeks of development, respectively. First, we applied multiexponential T(2) analysis for the quantification of matrix macromolecule-associated water compartments. Second, we applied multivariate support vector machine analysis using multiple MR parameters to improve detection of degree of matrix development. Monoexponential T(2) values decreased with maturation, but without further specificity. Much more specific information was provided by multiexponential analysis. The T(2) distribution in both immature and mature constructs was qualitatively comparable to that of native cartilage. The analysis showed that proteoglycan-bound water increased significantly during maturation, from a fraction of 0.05 ± 0.01 to 0.07 ± 0.01. Classification of samples based on individual MR parameters, T(1), T(2), k(m) or apparent diffusion coefficient, showed that the best classifiers were T(1) and k(m), with classification accuracies of 85% and 84%, respectively. Support vector machine analysis improved the accuracy to 98% using the combination (k(m), apparent diffusion coefficient). These approaches were validated using biochemical and Fourier transform infrared imaging spectroscopic analyses, which showed increased proteoglycan and collagen with maturation. In summary, multiexponential T(2) and multivariate support vector machine analyses provide improved sensitivity to changes in matrix development and specificity to matrix composition in tissue engineered cartilage. These approaches show substantial potential for the evaluation of engineered cartilage tissue and for extension to other tissue engineering constructs.
Copyright © 2012 John Wiley & Sons, Ltd.
Figures
References
-
- Kuo AC, Rodrigo JJ, Reddi AH, Curtiss S, Grotkopp E, Chiu M. Microfracture and bone morphogenetic protein 7 (BMP-7) synergistically stimulate articular cartilage repair. Osteoarthritis Cartilage. 2006;14(11):1126–1135. - PubMed
-
- Malinin T, Temple HT, Buck BE. Transplantation of osteochondral allografts after cold storage. J Bone Joint Surg Am. 2006;88(4):762–770. - PubMed
-
- Nugent AE, Reiter DA, Fishbein KW, McBurney DL, Murray T, Bartusik D, Ramaswamy S, Spencer RG, Horton WE. Characterization of Ex Vivo-Generated Bovine and Human Cartilage by Immunohistochemical, Biochemical, and Magnetic Resonance Imaging Analyses. Tissue Engineering Part A. 2010;16(7):2183–2196. - PMC - PubMed
-
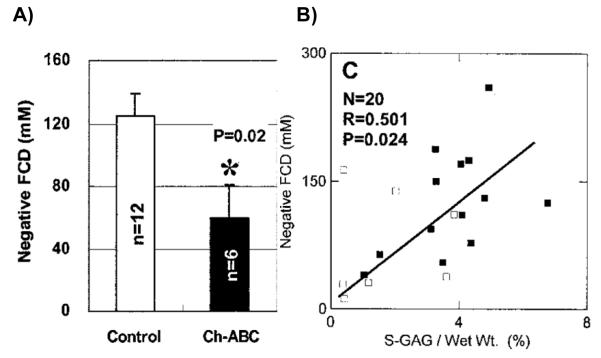
- Chen CT, Fishbein KW, Torzilli PA, Hilger A, Spencer RGS, Horton WE. Matrix fixed-charge density as determined by magnetic resonance microscopy of bioreactor-derived hyaline cartilage correlates with biochemical and biomechanical properties. Arthritis And Rheumatism. 2003;48(4):1047–1056. - PubMed
Publication types
MeSH terms
Substances
Grants and funding
LinkOut - more resources
Full Text Sources
