Comparative Study
. 2012 Mar 1;188(5):2305-15.
doi: 10.4049/jimmunol.1103484. Epub 2012 Jan 27.

Skewed primary Igκ repertoire and V-J joining in C57BL/6 mice: implications for recombination accessibility and receptor editing

Affiliations
Comparative Study

Skewed primary Igκ repertoire and V-J joining in C57BL/6 mice: implications for recombination accessibility and receptor editing

Miyo Aoki-Ota et al. J Immunol. .

Abstract

Previous estimates of the diversity of the mouse Ab repertoire have been based on fragmentary data as a result of many technical limitations, in particular, the many samples necessary to provide adequate coverage. In this study, we used 5'-coding end amplification of Igκ mRNAs from bone marrow, splenic, and lymph node B cells of C57BL/6 mice combined with amplicon pyrosequencing to assess the functional and nonfunctional Vκ repertoire. To evaluate the potential effects of receptor editing, we also compared V/J associations and usage in bone marrows of mouse mutants under constitutive negative selection or an altered ability to undergo secondary recombination. To focus on preimmune B cells, our cell sorting strategy excluded memory B cells and plasma cells. Analysis of ~90 Mbp, representing >250,000 individual transcripts from 59 mice, revealed that 101 distinct functional Vκ genes are used but at frequencies ranging from ~0.001 to ~10%. Usage of seven Vκ genes made up >40% of the repertoire. A small class of transcripts from apparently nonfunctional Vκ genes was found, as were occasional transcripts from several apparently functional genes that carry aberrant recombination signals. Of 404 potential V-J combinations (101 Vκs × 4 Jκs), 398 (98.5%) were found at least once in our sample. For most Vκ transcripts, all Jκs were used, but V-J association biases were common. Usage patterns were remarkably stable in different selective conditions. Overall, the primary κ repertoire is highly skewed by preferred rearrangements, limiting Ab diversity, but potentially facilitating receptor editing.


Figures
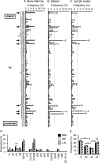
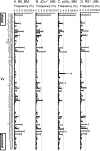
FIGURE 1
FIGURE 1
Distribution of IgκL-chain gene segment usage in B cells isolated from lymphoid tissues of C57BL/6 (B6) mice.IgκcDNA derived from 5'-RACE amplicons were sequenced by 454 technology and analyzed as described (39). A-C, Percent usage of each Vκ gene is displayed according to chromosomal order relative to the JκCκ cluster. A, Bone marrow (BM, solid bar); B,spleen (SP, open bar); C, lymph nodes (LN, lined bar). Arrows indicate 7 genesused in more than 4% of total in BM, which is 4 times above the theoretical average and indicated with dotted lines.Vκare listed according to the IMGT nomenclature (17). D,Comparison of Vκ family usage in B6 B cells.n=3 with each sequencing sample representing a pool of from 4 or 5 mice per group in BM and 2 mice per group in SP and LN samples. Mean for each group indicated by a horizontal bar. Asterisks show p values calculated by Chi-square test. ***; p<0.001. E, Frequency of Jκ usage in the indicated lymphoid organs is shown. p values calculated by Chi-squared test. **; p<0.01, ***; p<0.001.
FIGURE 2
FIGURE 2
Analysis of functional and non-functional Vκ rearrangements in BM. A,Shown are frequencies of functional (filled diamonds) and non-functional (open squares) rearrangements in B6 BM as a percentage of the total. Each point represents the mean value obtained for a Vκ. The order follows that on the chromosome from Jκ distal (left) to proximal (right).B, Comparison of relative Vκusage frequency of non-functional B6 BM transcripts (open squares) to functional pUliκtranscripts(filled diamonds). n=3 with each sample representing a pool of from 4 or 5 mice in B6 and 3 to 5 mice in pUliκ BM samples. Mean for each group is indicated by a horizontal bar. C,Shown are percentage usagesof functional sequences in the major genes in B6 BM. n=3 with each sample representing a pool of from 4 or 5 mice per group with a mean for each group indicated by a bar.***; p<0.0001, Chi-squaredtest.D, Jκ usage frequencies among functional (“F”) and non functional (“NF”) B6 BM samples. E,Jκ usages among the seven most commonly used Vκs. In D and E Jκs are as indicated by the fills of the square symbols: Jκ1, black; Jκ2, white; Jκ4, gray; Jκ5, striped.
FIGURE 3
FIGURE 3
Analysis of the correlations between Vκ gene usage, recombination signal efficiency, chromosomal location and orientation, and Jκ usage.A,Correlation between individual Vκ gene usage and predicted recombination signal efficiency (RIC value).B,comparison of Vκ associations with Jκ1 and Jκ5 in B6 BM. Percent usages ofJκ1 (filled portion of bars) and Jκ5 (white portion of bars)among functional rearrangements are shown (stacked bars show combined frequency). Vκ genes are ordered by their chromosomal position from distal to proximal to Jκs.Arrows indicate the 7 major genes. Solid diamonds below the x-axis indicate genes that are in the same initial orientation as the JκCκ cluster (hence “deletional” when associated with Jκ1). n=3 with each sample representing a pool of from 4 or 5 mice per group with a mean for each group indicated.
FIGURE 4
FIGURE 4
Igκ repertoire in BM from B6 and genetically modified mouse strains. Shown are usage frequencies of Vκ genesamong functional rearrangements in B cells from the following strains.A,B6;B,JCκ+/−;C,pUliκ; and D,RS−/−. Arrows indicate 7 major geneswith open bar that were found in >4% of sequences from B6 BM. Vκ genes are ordered by their chromosomal position from distal to proximal to Jκs.n=3 with each sample representing a pool of from3 to 5 mice per group in each strain with mean for each group indicated by a horizontal bar.
FIGURE 5
FIGURE 5
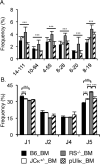
Comparative usage analysis in BM of B6 and genetically-modified strains showing Vκswith elevated usage in RS−/− and overall Jκ usage distributions. A, Frequencies of 6 genes with increased representation in RS−/− samples is shown. B,BM Jκ usages of the indicated strains are shown. B6, solid bar;JCκ+/−, open bar; RS−/−, grey bar; pUliκ, lined bar. n=3 with each sample representing a pool of from3 to 5 mice per group in each strain.Asterisks show significant differences, with p values calculated by Chi-square test.*;p<0.05, **; p<0.01, ***; p<0.001.
FIGURE 6
FIGURE 6
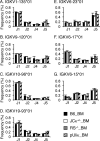
Jκ usages associated with the major Vκ genesin BM of B6, JCκ+/−, RS−/−, and pUIiκ mice. B6, solid bar;JCκ+/−, open bar; RS−/−, grey bar; pUliκ, lined bar. n=3 with each sample representing a pool of from3 to 5 mice per group in each strain with a mean for each group indicated by a horizontal bar.
FIGURE 7
FIGURE 7
Analysis of the diversity of the expressedκ-chain repertoire in B6 BM. A,The integrated frequency of Vκ usage is plotted in declining order of usage frequency. Asterisk indicates the contributions of the 7 major genes, yielding a 43% integrated frequency of these genes. B, CDR3 diversity produced by all VJ associations is shown. Asterisk indicates total CDR3 amino acid variety contributed by the major 7 genes.
FIGURE 8
FIGURE 8
Potential looping of Igκ locus based on the reported CTCF binding sites. Cartoon depictsIgκ locus assuming clustering of major CTCF sites, highlighting distribution of major Vκs and Vκ4 family on loops. CTCF sites, blue circles; major Vκ genes, yellow arrows; Vκ genes used at 1–3.9 % of total, medium sized green arrows; infrequently used Vκ genes (<1% of total), small red arrows. Jκs and Cκ are indicated by pink symbols and blue arrow, respectively. RS; blue solid diamond.

References

    1. Apel TW, Scherer A, Adachi T, Auch D, Ayane M, Reth M. The ribose 5-phosphate isomerase-encoding gene is located immediately downstream from that encoding murine immunoglobulin kappa. Gene. 1995;156:191–197. - PubMed
    1. George JB, Li S, Garrard WT. Yeast artificial chromosome contigs reveal that distal variable-region genes reside at least 3 megabases from the joining regions in the murine immunoglobulin kappa locus. Proc Natl Acad Sci U S A. 1995;92:12421–12425. - PMC - PubMed
    1. Schable KF, Thiebe R, Bensch A, Brensing-Kuppers J, Heim V, Kirschbaum T, Lamm R, Ohnrich M, Pourrajabi S, Roschenthaler F, Schwendinger J, Wichelhaus D, Zocher I, Zachau HG. Characteristics of the immunoglobulin Vkappa genes, pseudogenes, relics and orphons in the mouse genome. Eur J Immunol. 1999;29:2082–2086. - PubMed
    1. Thiebe R, Schable KF, Bensch A, Brensing-Kuppers J, Heim V, Kirschbaum T, Mitlohner H, Ohnrich M, Pourrajabi S, Roschenthaler F, Schwendinger J, Wichelhaus D, Zocher I, Zachau HG. The variable genes and gene families of the mouse immunoglobulin kappa locus. Eur J Immunol. 1999;29:2072–2081. - PubMed
    1. Roschenthaler F, Kirschbaum T, Heim V, Kirschbaum V, Schable KF, Schwendinger J, Zocher I, Zachau HG. The 5' part of the mouse immunoglobulin kappa locus. Eur J Immunol. 1999;29:2065–2071. - PubMed

Publication types

MeSH terms

Substances