

A Tutorial and Case Study in Propensity Score Analysis: An Application to Estimating the Effect of In-Hospital Smoking Cessation Counseling on Mortality
- PMID: 22287812
- PMCID: PMC3266945
- DOI: 10.1080/00273171.2011.540480
A Tutorial and Case Study in Propensity Score Analysis: An Application to Estimating the Effect of In-Hospital Smoking Cessation Counseling on Mortality
Abstract
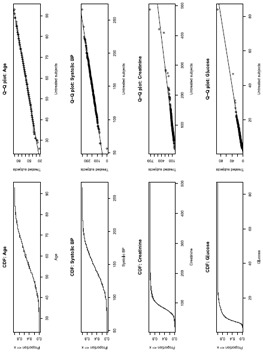
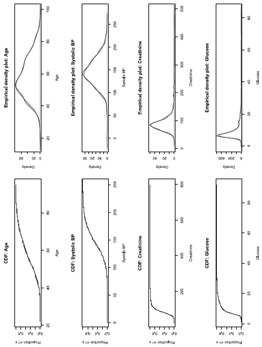
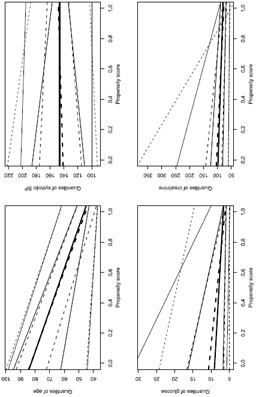
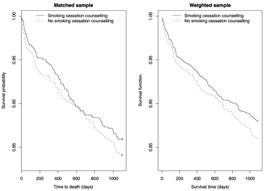
Propensity score methods allow investigators to estimate causal treatment effects using observational or nonrandomized data. In this article we provide a practical illustration of the appropriate steps in conducting propensity score analyses. For illustrative purposes, we use a sample of current smokers who were discharged alive after being hospitalized with a diagnosis of acute myocardial infarction. The exposure of interest was receipt of smoking cessation counseling prior to hospital discharge and the outcome was mortality with 3 years of hospital discharge. We illustrate the following concepts: first, how to specify the propensity score model; second, how to match treated and untreated participants on the propensity score; third, how to compare the similarity of baseline characteristics between treated and untreated participants after stratifying on the propensity score, in a sample matched on the propensity score, or in a sample weighted by the inverse probability of treatment; fourth, how to estimate the effect of treatment on outcomes when using propensity score matching, stratification on the propensity score, inverse probability of treatment weighting using the propensity score, or covariate adjustment using the propensity score. Finally, we compare the results of the propensity score analyses with those obtained using conventional regression adjustment.
Figures

References
-
- Agresti A., Min Y. Effects and non-effects of paired identical observations in comparing proportions with binary matched-pairs data. Statistics in Medicine. 2004;23:65–75. - PubMed
-
- Austin P. C. Propensity-score matching in the cardiovascular surgery literature from 2004 to 2006: A systematic review and suggestions for improvement. Journal of Thoracic and Cardiovascular Surgery. 2007a;134:1128–1135. doi:10.1016/j.jtcvs.2007.07.021. - PubMed
-
- Austin P. C. The performance of different propensity score methods for estimating marginal odds ratios. Statistics in Medicine. 2007b;26:3078–3094. doi:10.1002/sim.2781. - PubMed
-
- Austin P. C. A critical appraisal of propensity score matching in the medical literature from 1996 to 2003. Statistics in Medicine. 2008a;27:2037–2049. doi:10.1002/sim.3150. - PubMed
-
- Austin P. C. A report card on propensity-score matching in the cardiology literature from 2004 to 2006: Results of a systematic review. Circulation: Cardiovascular Quality and Outcomes. 2008b;1:62–67. doi:10.1161/CIRC0UTC0MES.108.790634. - PubMed
Grants and funding
LinkOut - more resources
Full Text Sources