

Real-time Imaging of Ca-handling in Intact Renal Glomeruli Using Confocal Microscopy
- PMID: 22287941
- PMCID: PMC3266942
Real-time Imaging of Ca-handling in Intact Renal Glomeruli Using Confocal Microscopy
Abstract
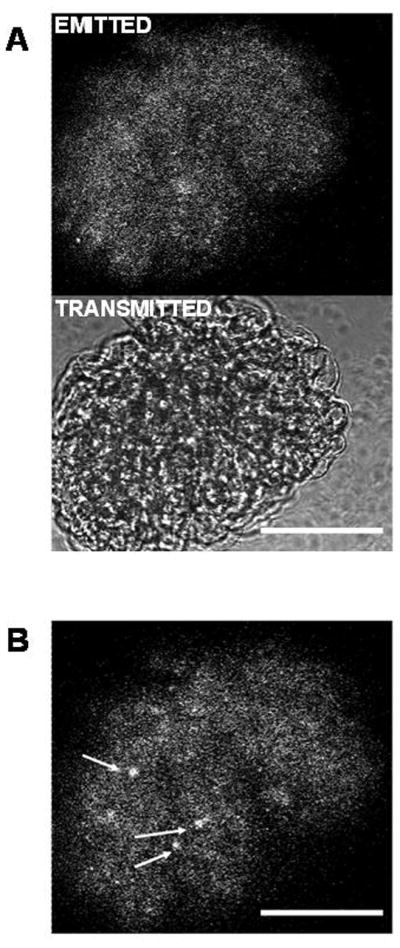
Glomeruli are filtering units in the kidneys. Being multicellular and complex in structure, many aspects of glomerular function are yet to be elucidated. Most studies use glomerular cells in culture, which may exhibit altered physiology compared to native cells. Confocal microscopy has opened new avenues in exploring in situ glomerular function and physiology. In this report, we propose experimenting with glomerular cells in renal cortical slices and isolated intact glomeruli for Ca(2+)-handling studies. Cortical slices (100 μm thick) were obtained from mice while intact glomeruli were isolated from rats using the sieving method. These were loaded with fluo-4 and then placed in a confocal microscope. Fluo-4 was excited using a 488 nm photodiode laser and images were collected at 1 frame/sec. Changes in average fluorescence intensity (AFI) were interpreted as changes in [Ca(2+)](i). AFI increased to 37.1 ± 6.7% and 84.3 ± 20.9% with Ang II (0.01 and 0.1 μM respectively). Norepinephrine (10 μM), arginine vasopressin (0.1 μM) and K(+) (30 mM) also elevated AFI by 26.5 ± 6.8%, 22.3 ± 1.0% and 39.8 ± 10.3% respectively in the glomerular cells. Likewise in isolated glomeruli, Ang II (0.1-10 μM), K(+) (30-90 mM) and endothelin-1 (0.01-1 μM), all showed elevation in [Ca(2+)](i). These results give an impetus for future studies examining Ca(2+)-handling by confocal microscopy in glomerular cells using renal cortical slices and isolated intact glomeruli. The results support the utility of this system for study of glomerular physiology and pharmacology.
Figures


Similar articles
-
[Isolation and culture of renal glomeruli from rats].Sheng Li Xue Bao. 2015 Dec 25;67(6):629-35. Sheng Li Xue Bao. 2015. PMID: 26701640 Chinese.
-
Fluorescence imaging of intracellular calcium signals in intact kidney tissue.Nephron Exp Nephrol. 2012;121(1-2):e49-58. doi: 10.1159/000342812. Epub 2012 Nov 8. Nephron Exp Nephrol. 2012. PMID: 23147410
-
Angiotensin II increases the intracellular calcium activity in podocytes of the intact glomerulus.Kidney Int. 2000 Jan;57(1):41-9. doi: 10.1046/j.1523-1755.2000.00810.x. Kidney Int. 2000. PMID: 10620186
-
Atubular glomeruli and the structural basis for chronic renal failure.Lab Invest. 1992 Mar;66(3):265-84. Lab Invest. 1992. PMID: 1538583 Review.
-
Drebrin in Renal Glomeruli.Adv Exp Med Biol. 2017;1006:337-345. doi: 10.1007/978-4-431-56550-5_20. Adv Exp Med Biol. 2017. PMID: 28865030 Review.
References
-
- IFKF, International Federation of Kidney Foundations. [Accessed 2009 April 2];Key facts. 2008 Available: http://www.worldkidneyday.org/pages/facts.php.
-
- Stockand JD, Sansom SC. Glomerular mesangial cells: electrophysiology and regulation of contraction. Physiol Rev. 1998;78:723–744. - PubMed
-
- Rodriguez-Barbero A, L’Azou B, Cambar J, Lopez-Novoa JM. Potential use of isolated glomeruli and cultured mesangial cells as in vitro models to assess nephrotoxicity. Cell Biol Toxicol. 2000;16:145–153. - PubMed
-
- Cortes P, Riser BL, Yee J, Narins RG. Mechanical strain of glomerular mesangial cells in the pathogenesis of glomerulosclerosis: clinical implications. Nephrol Dial Transplant. 1999;14:1351–1354. - PubMed
Grants and funding
LinkOut - more resources
Full Text Sources
Miscellaneous