. 2012 May;13(5):643-9.
doi: 10.1111/j.1600-0854.2012.01336.x. Epub 2012 Feb 20.

Assessing the tendency of fluorescent proteins to oligomerize under physiologic conditions

Affiliations

Assessing the tendency of fluorescent proteins to oligomerize under physiologic conditions

Lindsey M Costantini et al. Traffic. 2012 May.

Abstract

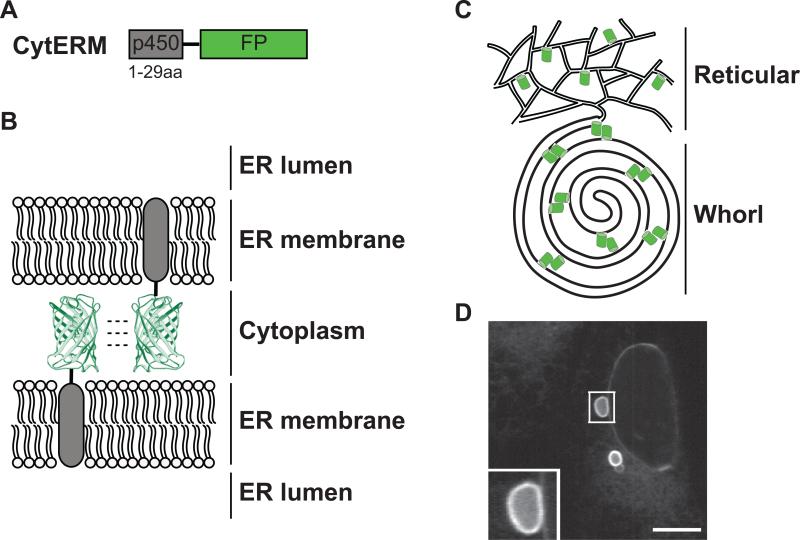
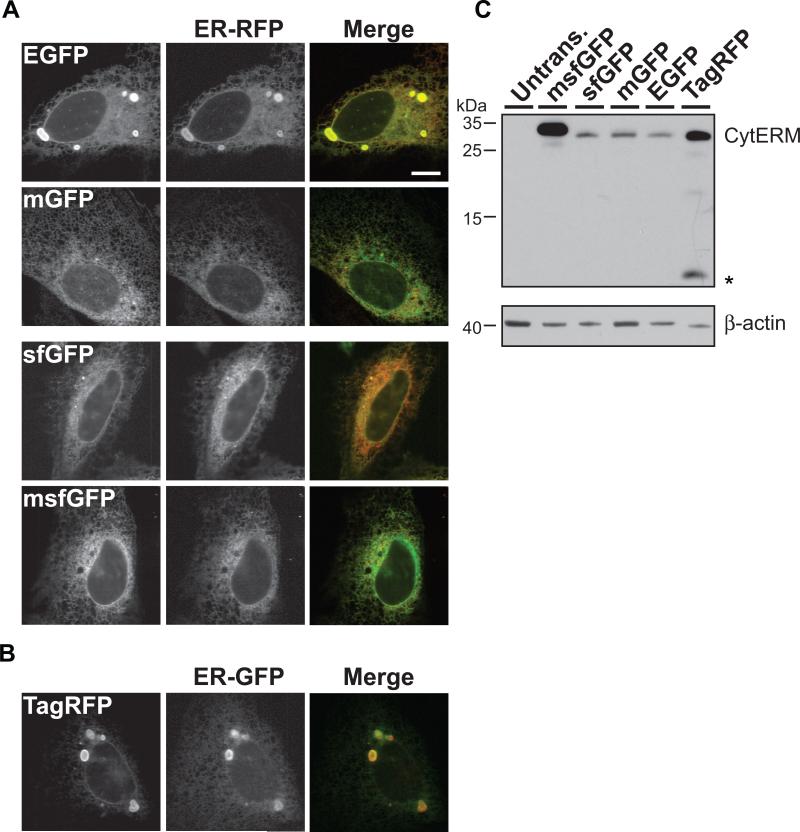
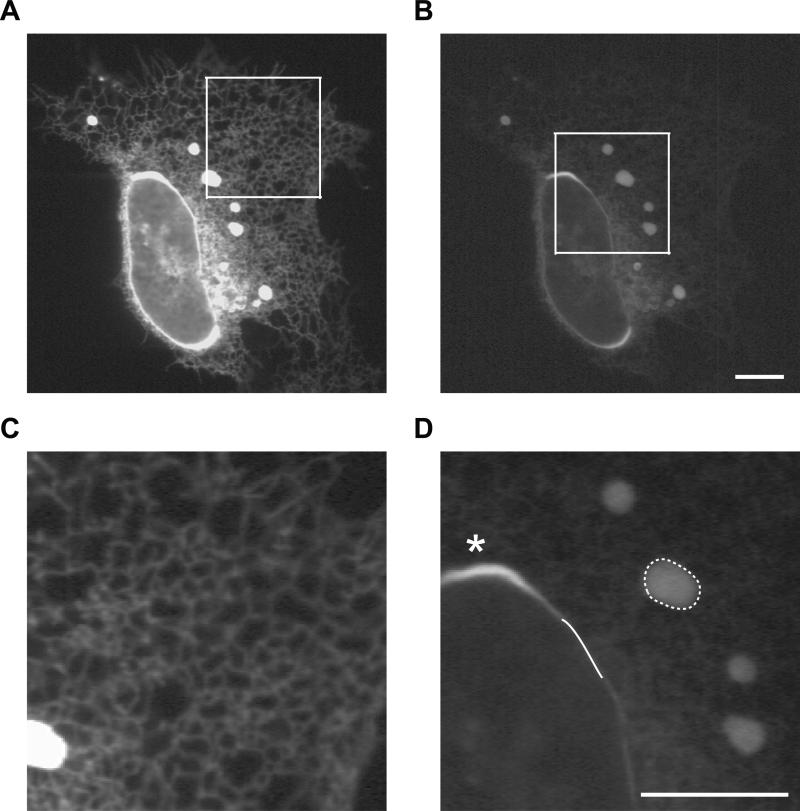
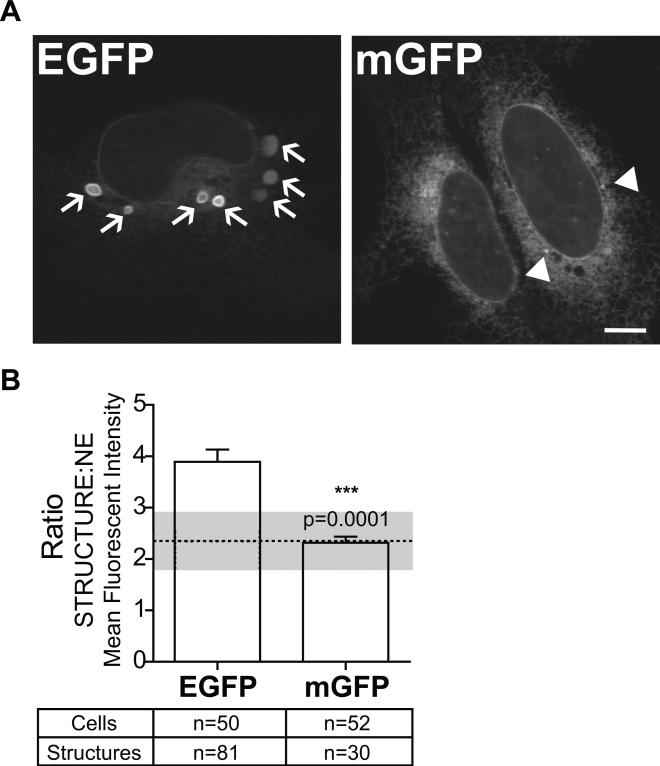
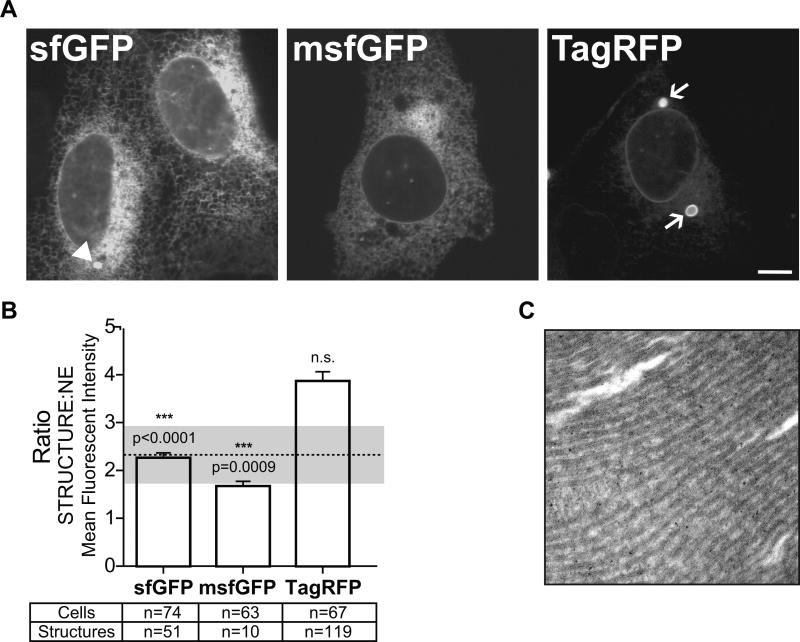
Several fluorescent proteins (FPs) are prone to forming low-affinity oligomers. This undesirable tendency is exacerbated when FPs are confined to membranes or when fused to naturally oligomeric proteins. Oligomerization of FPs limits their suitability for creating fusions with proteins of interest. Unfortunately, no standardized method evaluates the biologically relevant oligomeric state of FPs. Here, we describe a quantitative visual assay for assessing whether FPs are sufficiently monomeric under physiologic conditions. Membrane-associated FP-fusion proteins, by virtue of their constrained planar geometry, achieve high effective concentrations. We exploited this propensity to develop an assay to measure FP tendencies to oligomerize in cells. FPs were fused on the cytoplasmic end of an endoplasmic reticulum (ER) signal-anchor membrane protein (CytERM) and expressed in cells. Cells were scored based on the ability of CytERM to homo-oligomerize with proteins on apposing membranes and restructure the ER from a tubular network into organized smooth ER (OSER) whorl structures. The ratio of nuclear envelope and OSER structures mean fluorescent intensities for cells expressing enhanced green fluorescent protein (EGFP) or monomeric green fluorescent protein (mGFP) CytERM established standards for comparison of uncharacterized FPs. We tested three FPs and identified two as sufficiently monomeric, while a third previously reported as monomeric was found to strongly oligomerize.


Figures

Figure 1
Figure 1. Expression of CytERM restructures the ER into OSER through oligomeric interactions of fluorescent proteins
(A) CytERM, fusion illustration of amino acids 1-29 of cytochrome p450 with fluorescent protein. (B) Model of opposing ER membrane remodeling due to fluorescent protein oligomerization. (C) Illustration depicting reorganization of ER due to fluorescent protein interaction from typical reticular network to OSER whorl. (D) OSER whorl in U2OS cells transiently expressing CytERM-EGFP. Inset of OSER whorl. Scale bar = 10 μm.
Figure 2
Figure 2. Characterization of CytERM
(A) CytERM-EGFP, -mGFP, -sfGFP, -msfGFP colocalizes with ER-RFP in the ER in co-transfected U2OS cells. (B) CytERM-TagRFP colocalizes with ER-GFP within the ER of co-transfected U2OS cells. Scale bars = 10 μm (C) Immunoblot of cells transfected with CytERM-EGFP, mGFP, sfGFP, msfGFP and TagRFP and stained with anti-GFP or anti-RFP migrate to predicted molecular weights (upper blot). Asterisks (*) indicate TagRFP cleavage product produced during cell lysate preparation. Anti-β-actin stained blot illustrates comparable sample loading (lower blot).
Figure 3
Figure 3. Cell selection criteria and manual measurement practice for OSER assay
(A) Representative image depicting selection criteria of OSER assay. CytERM-EGFP expressing U2OS cells with reticular ER network characteristic of cells selected for analysis. (B) Zoomed inset of (A). (C) OSER whorl structures are induced in cells expressing CytERM-EGFP. (D) Inset of (C) represents the manual tracing of OSER whorl (dotted line) and nuclear envelope MFI measurements (solid line) required for quantitative analysis. Asterisks (*) highlight a region of the nuclear envelop excluded from analysis. Scale bars = 10 μm.
Figure 4
Figure 4. Analysis of CytERM-EGFP and -mGFP validates the methodology of OSER assay
(A) CytERM-EGFP induced OSER whorl structures in transiently expressed in U2OS cells (arrows highlight OSER whorls). CytERM-mGFP expression produces structures that are not OSER whorls (arrowheads highlight non-OSER structures). All structures are manually traced during analysis. Scale bar = 10 μm. (B) OSER assay ratiometric measurements of structures:nuclear envelope MFI, values presented as mean±SEM. Dotted line indicates monomeric threshold of fluorescent proteins, 2.3 ± 0.1.
Figure 5
Figure 5. Application of OSER assay to uncharacterized sfGFP, monomerized sfGFP and TagRFP reveal sfGFPs as monomer as determined by CytERM-mGFP threshold value
(A) U2OS cells transiently expressing CytERM-sfGFP, -msfGFP or -TagRFP. CytERM-sfGFP expressing cells contain non-OSER whorl structures (arrow head). CytERM-TagRFP transfected cells produce OSER whorls as indicated by arrows. Scale bar = 10 μm. (B) Ratio values presented as mean ± SEM of CytERM-sfGFP, -msfGFP and -TagRFP (structure:nuclear envelope MFI). Dotted line indicates monomeric threshold of fluorescent proteins, 2.3 ± 0.1. CytERM-sfGFP, -msfGFP fall below the monomeric threshold and are statistically significantly different (p<0.0001, 0.0009 respectively), indicating both FPs are monomeric by these measurements. CytERM-TagRFP ratio measurement, 3.9 ± 0.2, is not statistically different from CytERM-dGFP ratio measurements (3.9 ± 0.2). (C) Electron micrograph image of U2OS cells transiently expressing CytERM-TagRFP, showing representative stacked ER membrane characteristic of OSER structures.

References

    1. Heim R, Prasher DC, Tsien RY. Wavelength mutations and posttranslational autoxidation of green fluorescent protein. Proc Natl Acad Sci. 1994;91:12501–4. - PMC - PubMed
    1. Prasher DC, Eckenrode VK, Ward WW, Prendergast FG, Cormier MJ. Primary structure of the Aequorea victoria green-fluorescent protein. Gene. 1992;111:229–233. - PubMed
    1. Shaner NC, Patterson GH, Davidson MW. Advances in fluorescent protein technology. J Cell Sci. 2007;120:4247–60. - PubMed
    1. Snapp EL. Fluorescent proteins: a cell biologist's user guide. Trends in Cell Biol. 2009;19:649–55. - PMC - PubMed
    1. Pédelacq J-D, Cabantous S, Tran T, Terwilliger TC, Waldo GS. Engineering and characterization of a superfolder green fluorescent protein. Nat Biotechnol. 2006;24:79–88. - PubMed

Publication types

Substances