. 2012 Apr 15;60(3):1622-9.
doi: 10.1016/j.neuroimage.2012.01.075. Epub 2012 Jan 25.

MRI hippocampal and entorhinal cortex mapping in predicting conversion to Alzheimer's disease

Affiliations

MRI hippocampal and entorhinal cortex mapping in predicting conversion to Alzheimer's disease

D P Devanand et al. Neuroimage. .

Abstract

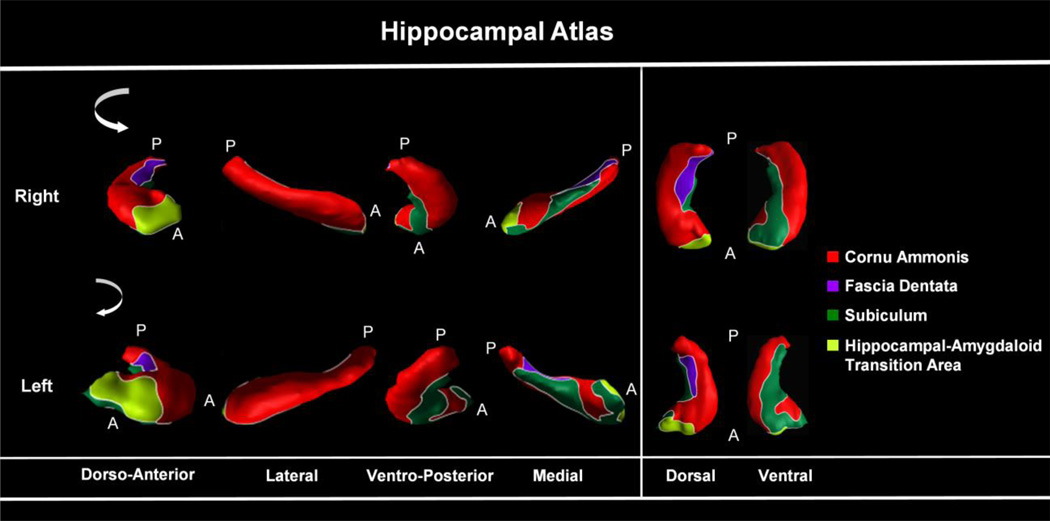
Objective: Using MRI surface morphometry mapping, to evaluate local deformations of the hippocampus, parahippocampal gyrus, and entorhinal cortex in predicting conversion from mild cognitive impairment (MCI) to Alzheimer's disease (AD).

Methods: Baseline brain MRI with surface morphological analysis was performed in 130 outpatients with MCI, broadly defined, and 61 healthy controls followed for an average of 4 years in a single site study.

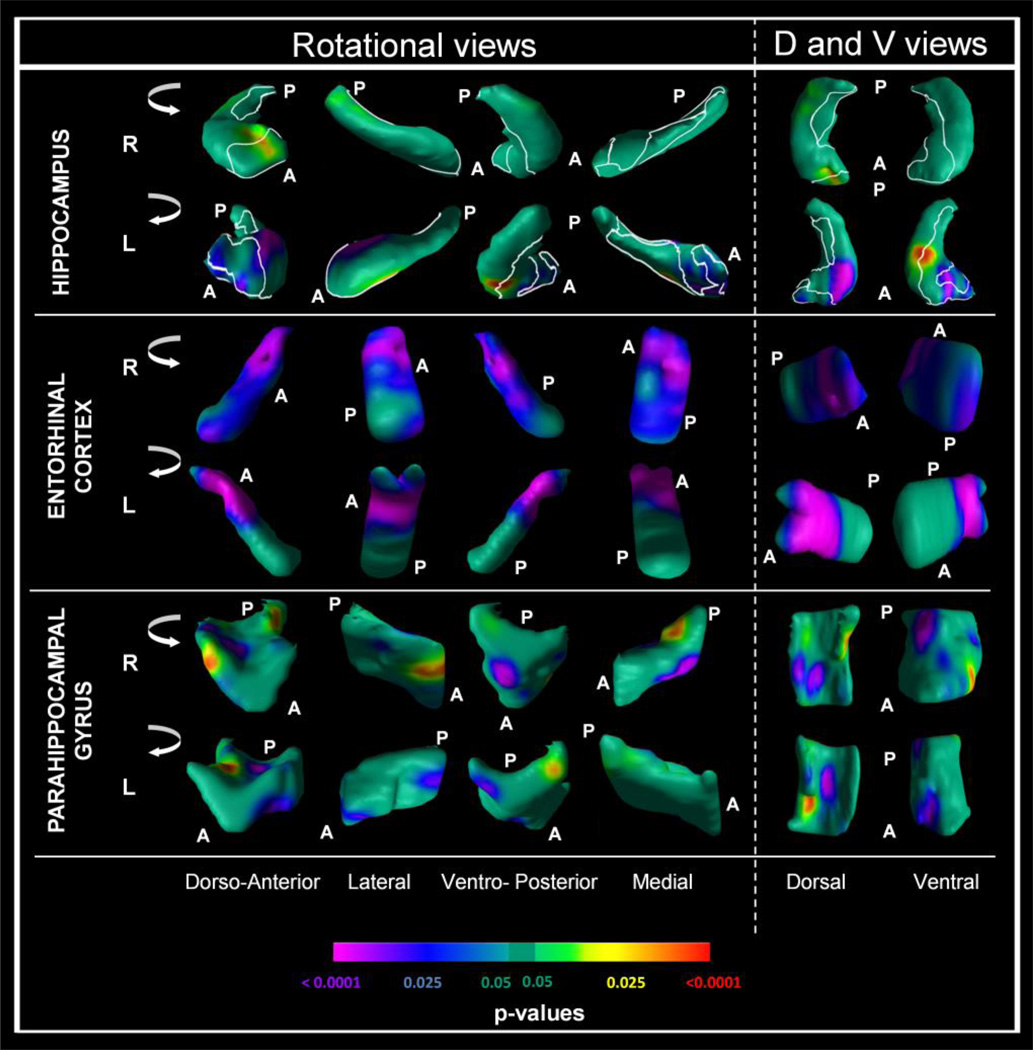
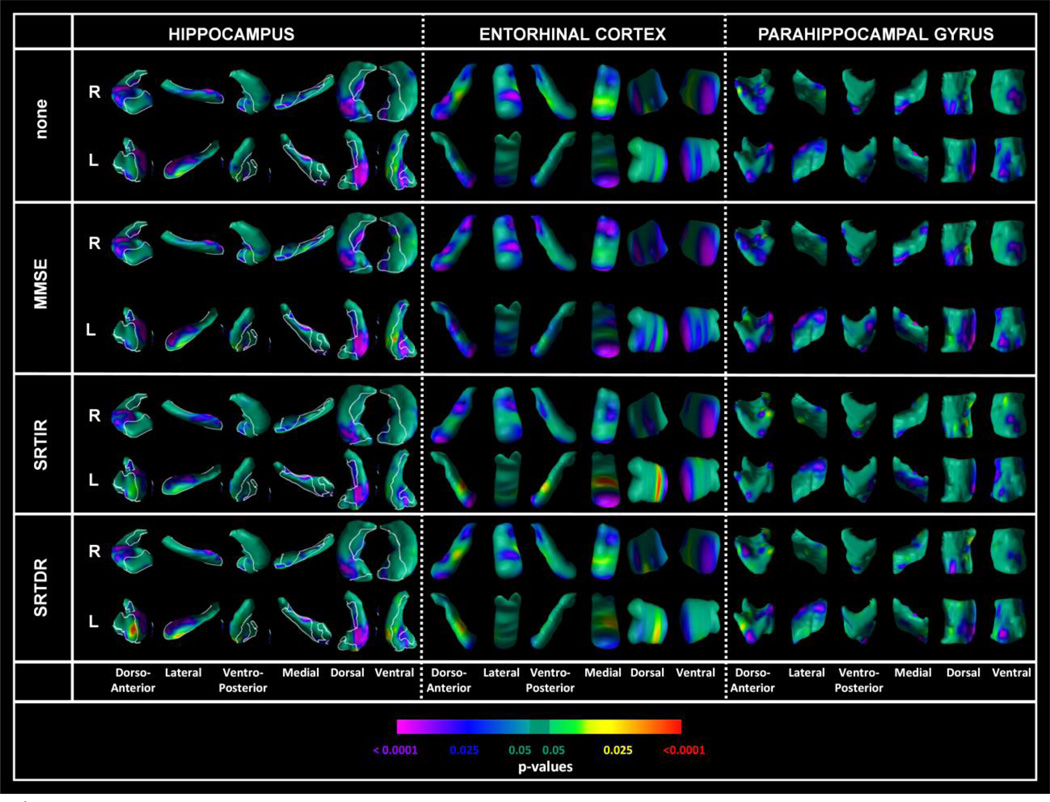
Results: Patients with MCI differed from controls in several regions of the hippocampus and entorhinal cortex, and to a lesser extent in the parahippocampal gyrus. In the MCI sample, Cox regression models were conducted for time to conversion comparing converters to AD (n=31) and non-converters (n=99), controlling for age, sex and education. Converters showed greater atrophy in the head of the hippocampus, predominantly in the CA1 region and subiculum, and in the entorhinal cortex, especially in the anterior-inferior pole bilaterally. When distances of specific points representing localized inward deformation were entered together with the corresponding hippocampal or entorhinal cortex volume in the same Cox regression model, the distances remained highly significant whereas the volumes of the corresponding structures were either marginally significant or not significant. Inclusion of cognitive or memory measures or apolipoprotein E ε4 genotype as covariates, or restricting the sample to patients with amnestic MCI (24 converters and 81 non-converters) did not materially change the findings. In the 3-year follow-up sample of patients with MCI, logistic regression analyses using the same measures and covariates yielded similar results.

Interpretation: These findings indicate selective early involvement of the CA1 and subiculum regions of the hippocampus and provide new information on early anterior pole involvement in the entorhinal cortex in incipient AD. Fine-grained surface morphometry of medial temporal lobe structures may be superior to volumetric assessment in predicting conversion to AD in patients clinically diagnosed with MCI.


Figures

Figure 1
Figure 1
Cytoarchitectonic atlas of Hippocampal Subregions:. the external morphologic projections of the four hippocampal subregions: RED = Cornu Ammonis, GREEN = subiculum, PURPLE = dentate gyrus, LIME GREEN = Hippocampal Amygdaloid transitional area. Only hippocampal subregions have been defined, not subregions of the entorhinal cortex or parahippocampal gyrus.
Figure 2
Figure 2
Comparison of 130 patients with mild cognitive impairment (MCI) and 61 normal controls. Analyses conducted at each point on the surface of the hippocampus, entorhinal cortex and parahippocampal gyrus, controlling for age, sex, education and intracranial volume. The right (R) and left (L) Hippocampus, right (R) and left (L) Entorhinal Cortex and the right (R) and left (L) Parahippocampal Gyrus are shown in shown in rotating views and in their dorsal (D) and ventral (V) orientations. All images reflect false discovery rate (FDR) correction for multiple statistical comparisons. The color bar indicates the color coding for P values associated with the main effect of diagnosis (MCI versus controls), with warmer colors (yellow and red) indicating protruding surfaces, presumably from larger underlying volumes, and cooler colors (blue and purple) indicating indented surfaces presumably from smaller underlying volumes in those locations.
Figure 3
Figure 3
Survival analyses in the MCI sample (n=130; 31 converters and 99 nonconverters). Survival analysis in the MCI sample, conducted at each point on the surface of (R) and left (L) Hippocampus, right (R) and left (L) Entorhinal Cortex and the right (R) and left (L) Parahippocampal Gyrus. All analyses controlled for age, sex, education, and intracranial volume. All images reflect false discovery rate (FDR) correction for multiple statistical comparisons. Cox regression (survival analysis) was conducted for the time to conversion to Alzheimer’s disease (AD, right-censored observations). Additional analyses also included total MMSE score (MMSE), SRT total immediate recall (SRTIR), or SRT delayed recall (SRTDR) as a covariate. Color bar coding and orientations and rotation views are the same as in Figure 2.

References

    1. Agster, et al. The hippocampus and disambiguation of overlapping sequences. J Neurosci. 2002;22:5760–5768. - PMC - PubMed
    1. Apostolova, et al. Conversion of mild cognitive impairment to Alzheimer disease predicted by hippocampal atrophy maps. Arch Neurol. 2006;63(5):693–699. - PubMed
    1. Apostolova, et al. 3D comparison of low, intermediate, and advanced hippocampal atrophy in MCI. Hum Brain Mapp. 2010;31:786–797. - PMC - PubMed
    1. Bansal, et al. ROC-based assessments of 3D cortical surface-matching algorithms. Neuroimage. 2005;24(1):150–162. - PubMed
    1. Bansal, et al. Statistical analyses of brain surfaces using Gaussian random fields on 2-D manifolds. IEEE Trans Med Imaging. 2007 Jan;26(1):46–57. - PMC - PubMed

Publication types

MeSH terms