. 2012 Mar 15;590(6):1495-509.
doi: 10.1113/jphysiol.2011.226399. Epub 2012 Jan 30.

Chronic maternal infusion of full-length adiponectin in pregnant mice down-regulates placental amino acid transporter activity and expression and decreases fetal growth

Affiliations

Chronic maternal infusion of full-length adiponectin in pregnant mice down-regulates placental amino acid transporter activity and expression and decreases fetal growth

Fredrick J Rosario et al. J Physiol. .

Abstract

Maternal adiponectin levels are inversely correlated to birth weight, suggesting that maternal adiponectin limits fetal growth. We hypothesized that full-length adiponectin (fADN) infusion in pregnant mice down-regulates placental amino acid transporters and decreases fetal growth. Starting at embryonic day (E) 14.5, fADN (0.62 ± 0.02 μg (g body weight)(−1) day(−1), n = 7) or vehicle (control, n = 9) were infused in pregnant C57/BL6 mice by mini-osmotic pump. At E18.5, dams were killed and placental homogenates and trophoblast plasma membrane (TPM) vesicles were prepared. Infusion of fADN elevated maternal serum fADN by 4-fold and decreased fetal weights by 18%. Adiponectin receptor 2, but not adiponectin receptor 1, was expressed in TPM. fADN infusion decreased TPM System A (–56%, P < 0.001) and System L amino acid transporter activity (–50%, P < 0.03). TPM protein expression of SNAT1, 2 and 4 (System A amino acid transporter isoforms) and LAT1 and LAT2, but not CD98, (System L amino acid transporter isoforms) was down-regulated by fADN infusion. To identify possible mechanisms underlying these changes we determined the phosphorylation of proteins in signalling pathways known to regulate placental amino acid transporters. fADN decreased phosphorylation of insulin receptor substrate-1 (Tyr-608), Akt (Thr-308 and Ser-473), S6 kinase 1 (Thr-389), eukaryotic initiation factor 4E binding protein 1 (Thr-37/46 and Thr-70) and ribosomal protein S6 (Ser-235/236) and increased the phosphorylation of peroxisome proliferator-activated receptor α (PPARα) (Ser-21) in the placenta. These data suggest that maternal adiponectin decreases fetal growth by down-regulation of placental amino acid transporters, which limits fetal nutrient availability. This effect may be mediated by inhibition of insulin/IGF-I and mTOR signalling pathways, which are positive regulators of placental amino acid transporters. We have identified a novel physiological mechanism by which the endocrine functions of maternal adipose tissue influence fetal growth.


Figures

Figure 1
Figure 1. Serum levels of ADN in control and fADN infused mice measured by Western blot
Proteins in serum samples (2 μl of 1:5 diluted sample) from dams infused with fADN (A) or vehicle (Control, C) and standards of recombinant fADN were separated by electrophoreses and probed using an antibody recognizing murine recombinant fADN. Standards (S) were 0.0185 (S1), 0.075 (S2), 0.15 (S3) and 0.3 μg (S4).
Figure 2
Figure 2. System A and System L amino acid transport activity in TPM
System A activity was measured as Na+-dependent uptake of µ14C½MeAIB and System L activity was determined using mediated uptake of µ3H½leucine. A and B, in time course studies using TPM from control animals only, uptakes were linear over 30 s (System A; r= 0.93, P < 0.0001, n= 6; System L; r= 0.89, P < 0.0001; n= 6; Spearman's rho). C and D, System A and L amino acid transporter activity, measured at 15 s, in TPM isolated from control (C) and fADN (A) infused mice. Values are given as means ± SEM (A and B) or means + SEM (C and D). *P < 0.05 in fADN group (n= 6) versus control (n= 6); Student's unpaired t test.
Figure 3
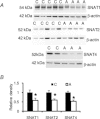
Figure 3. Relative protein expression of System A amino acid transporter isoforms in TPM isolated from control and fADN infused mice
A, representative Western blots for SNAT1, SNAT2 and SNAT4 in TPM isolated from mice placenta at E18.5. B, bar graph summarizing the Western blot data from control (C, n= 6) and fADN (A, n= 6) infused groups. After normalization to β-actin, the mean density of control samples was assigned an arbitrary value of 1. Individual C and A density values were expressed relative to this mean. Values are given as means + SEM. *P < 0.05 versus control; Student's unpaired t test.
Figure 4
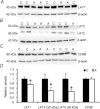
Figure 4. Relative protein expression of System L amino acid transporter isoforms in TPM isolated from control and fADN infused mice
AC, representative Western blots are shown for LAT1 (A), LAT2 (B) (30 kDa and 50 kDa) and CD98 (C) in TPM isolated from mice placenta at E18.5. D, bar graph summarizing the Western blot data from control (C, n= 6) and fADN (A, n= 6) infused groups. After normalization to β-actin, the mean density of control samples was assigned an arbitrary value of 1. Individual C and A density values were expressed relative to this mean. Values are given as means + SEM. *P < 0.05 versus control; Student's unpaired t test.
Figure 5
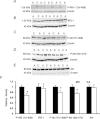
Figure 5. Relative placental IRS-1 and Akt phosphorylation in control and fADN infused mice
AE, representative Western blots for phosphorylated IRS-1 (Tyr-608) (A) and total IRS-1 (B), phosphorylated Akt Thr-308 (C), phosphorylated Akt Ser-473 (D) and total Akt (E) in homogenates of pooled placentas from control and fADN infused mice. F, bar graph summarizing the Western blot data from control (C, n= 9) and fADN (A, n= 7) mice. After normalization to β-actin, the mean density of control samples was assigned an arbitrary value of 1. Individual C and A density values were expressed relative to this mean. Values are given as means + SEM. *P < 0.05 versus control; Student's unpaired t test.
Figure 6
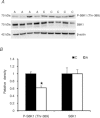
Figure 6. Relative placental S6K1 phosphorylation in control and fADN infused mice
A, representative Western blots of phosphorylated S6K1 (Thr-389) and total S6K1 in homogenates of mice placenta from control and fADN group at E18.5. C, summary of Western blot data from control (C, n= 9) and fADN (A, n= 7) infused mice. After normalization to β-actin, the mean density of control samples was assigned an arbitrary value of 1. Individual C and A density values were expressed relative to this mean. Values are given as means + SEM. *P < 0.05 versus control; Student's unpaired t test.
Figure 7
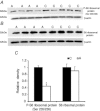
Figure 7. Relative placental 4E-BP1 phosphorylation in control and fADN infused mice
A and B, representative Western blots of 4E-BP1 (Thr-37/46) (A), phosphorylated (Thr-70) and total 4E-BP1 (B) in homogenates of mice placenta from control and fADN group at E18.5. Equal loading was performed. C, summary of Western blot data from control (C, n= 9) and fADN (A, n= 7) infused mice. After normalization to β-actin, the mean density of control samples was assigned an arbitrary value of 1. Individual C and A density values were expressed relative to this mean. Values are given as means + SEM. *P < 0.05 versus control; Student's unpaired t test.
Figure 8
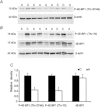
Figure 8. Relative placental S6 ribosomal protein phosphorylation in control (C) and fADN (A) infused mice
A and B, representative Western blots of phosphorylated S6 ribosomal protein (Ser-235/236) (A) and total S6 ribosomal protein (B) in homogenates of mice placenta from control and fADN group at E18.5. C, summary of Western blot data from control (C, n= 9) and fADN (A, n= 7) infused mice. After normalization to β-actin, the mean density of control samples was assigned an arbitrary value of 1. Individual C and A density values were expressed relative to this mean. Values are given as means + SEM. *P < 0.05 versus control; Student's unpaired t test.
Figure 9
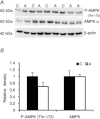
Figure 9. Relative placental AMPK phosphorylation in control and fADN infused mice
A, representative Western blots of phosphorylated AMPK (Thr-172) and total AMPK in homogenates of mice placenta from control and fADN group at E18.5. B, the expression levels of phosphorylated AMPK (Thr-172) and total AMPK from control (C, n= 9) and fADN (A, n= 7) infused group are shown in the bar graph. After normalization to β-actin, the mean density of control samples was assigned an arbitrary value of 1. Individual C and A density values were expressed relative to this mean. Values are given as means + SEM. *P < 0.05 versus control; Student's unpaired t test.
Figure 10
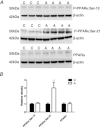
Figure 10. Relative placental PPARα phosphorylation in control and fADN infused mice
A, representative Western blots of phosphorylated (Ser-12 and Ser-21) and total PPARα in homogenates of mice placenta from control and fADN groups at E18.5. B, summary of data from control (C, n= 9) and fADN (A, n= 7) infused animals. After normalization to β-actin, the mean density of control samples was assigned an arbitrary value of 1. Individual C and A density values were expressed relative to this mean. Values are given as means + SEM. *P < 0.05 versus control; Student's unpaired t test.

Similar articles

Cited by

References

    1. Abbud W, Habinowski S, Zhang JZ, Kendrew J, Elkairi FS, Kemp BE, Witters LA, Ismail-Beigi F. Stimulation of AMP-activated protein kinase (AMPK) is associated with enhancement of Glut1-mediated glucose transport. Arch Biochem Biophys. 2000;380:347–352. - PubMed
    1. Ategbo JM, Grissa O, Yessoufou A, Hichami A, Dramane KL, Moutairou K, Miled A, Grissa A, Jerbi M, Tabka Z, Khan NA. Modulation of adipokines and cytokines in gestational diabetes and macrosomia. J Clin Endocrinol Metab. 2006;91:4137–4143. - PubMed
    1. Barker DJ, Hales CN, Fall CH, Osmond C, Phipps K, Clark PM. Type 2 (non-insulin-dependent) diabetes mellitus, hypertension and hyperlipidaemia (syndrome X): relation to reduced fetal growth. Diabetologia. 1993;36:62–67. - PubMed
    1. Boney CM, Verma A, Tucker R, Vohr BS. Metabolic syndrome in childhood: Association with birth weight, maternal obesity, and gestational diabetes. Pediatrics. 2005;115:e290–e296. - PubMed
    1. Caminos JE, Nogueiras R, Gallego R, Bravo S, Tovar S, Garcia-Caballero T, Casanueva FF, Dieguez C. Expression and regulation of adiponectin and receptor in human and rat placenta. J Clin Endocrinol Metab. 2005;90:4276–4286. - PubMed

Publication types