. 2012 Apr 15;590(8):1989-2008.
doi: 10.1113/jphysiol.2011.222422. Epub 2012 Jan 30.

Evaluating the physiological significance of respiratory sinus arrhythmia: looking beyond ventilation-perfusion efficiency

Affiliations

Evaluating the physiological significance of respiratory sinus arrhythmia: looking beyond ventilation-perfusion efficiency

A Ben-Tal et al. J Physiol. .

Abstract

We conducted a theoretical study of the physiological significance of respiratory sinus arrhythmia (RSA), a phenomenon used as an index of cardiac vagal tone and wellbeing, whereby the heart rate (HR) increases during inspiration and decreases during expiration. We first tested the hypothesis that RSA improves gas exchange efficiency but found that although gas exchange efficiency improved with slow and deep breathing and with increased mean heart rate, this was unrelated to RSA. We then formulated and tested a new hypothesis: that RSA minimizes the work done by the heart while maintaining physiological levels of arterial carbon dioxide. We tested the new hypothesis using two methods. First, the HR for which the work is minimized was calculated using techniques from optimal control theory. This calculation was done on simplified models that we derived from a previously published model of gas exchange in mammals. We found that the calculated HR was remarkably similar to RSA and that this became more profound under slow and deep breathing. Second, the HR was prescribed and the work done by the heart was calculated by conducting a series of numerical experiments on the previously published gas exchange model. We found that cardiac work was minimized for RSA-like HR functions, most profoundly under slow and deep breathing. These findings provide novel insights into potential reasons for and benefits of RSA under physiological conditions.


Figures

Figure 1
Figure 1. The hydrodynamic model analogy of gas transport
The left container represents the lungs and the right container represents the pulmonary capillaries.
Figure 2
Figure 2. Typical calculations of optimal heart rate and partial pressures in Models 1a and 1b
The inspired ventilation, qin, is the same for both models (top panel). The shaded areas show the inspiration period. The averaged arterial partial pressure of O2 (formula image
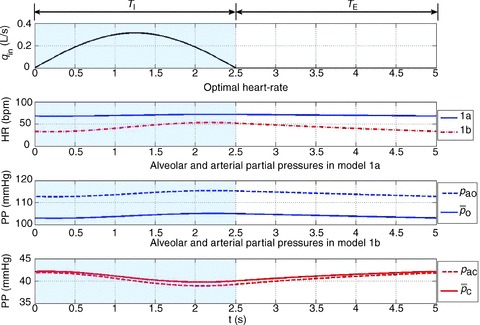
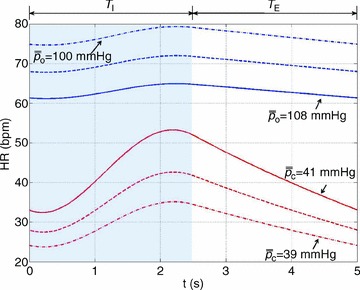
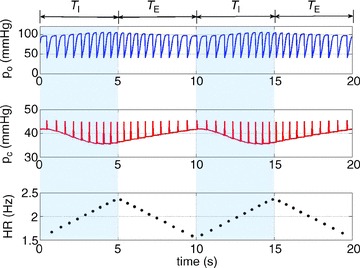
) was constrained to 104 mmHg, the averaged arterial partial pressure of CO2 (formula image
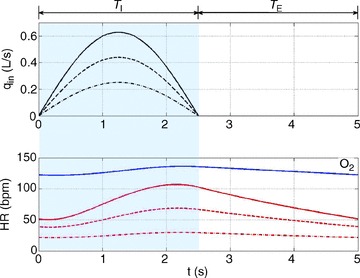
) was constrained to 41 mmHg, and VT= 0.5 l. All other parameters are the same as in Appendix A. Heart rate (HR) calculated for Model 1a – continuous line, HR calculated for Model 1b – dashed line. TI and TE are the inspiration and expiration periods, respectively. Note that O2 and CO2 are uncoupled.
Figure 7
Figure 7. Increased TI/TE ratio leads to a weaker RSA and a growing phase-shift between the maximum heart rate and the end of inspiration
The calculation was performed using Model 1b. The shaded areas show the inspiration period for each case. The respiratory cycle is 5 s and VT= 0.5 l in all cases. All other parameters are as in Appendix A. In blue TI/TE= 1:1, in red TI/TE= 1:2, and in black TI/TE= 2:1. The inspired ventilation, qin, is shown in the top panel.
Figure 3
Figure 3. The RSA-like shape of the R-R interval is preserved by all three models
The calculation of the R-R interval for the different models was performed using the optimal control technique described in Appendix D and taking the inverse of the optimal heart rate. VT = 1.0 l, T= 10 s, the averaged arterial partial pressure of CO2 was constrained to 41.5 mmHg. TI and TE are the inspiration and expiration periods, respectively. The shaded area shows the inspiration period.
Figure 4
Figure 4. Stronger RSA as a result of increased average arterial partial pressure of CO2
The optimal heart rate (HR) was calculated for Model 1a (top three curves) and Model 1b (bottom three curves) with VT= 0.5 l. In Model 1b, the averaged arterial partial pressure of CO2 was constrained to three values: 39 mmHg (dashed–dotted line), 40 mmHg (dashed line), 41 mmHg (continuous line). In Model 1a, the averaged arterial partial pressure of O2 was constrained to: 100 mmHg (dashed–dotted line), 104 mmHg (dashed line), 108 mmHg (continuous line). TI and TE are the inspiration and expiration periods, respectively. The shaded area shows the inspiration period.
Figure 5
Figure 5. Stronger RSA with increased tidal volume when the arterial partial pressure of CO2 is controlled (Model 1b)
The optimal heart rate (HR) was calculated for Model 1a (labelled ‘O2’) and Model 1b (remaining three curves). The inspired ventilation, qin, is the same for both models (top panel). In Model 1b, the averaged arterial partial pressure of CO2 was constrained to 40 mmHg. In Model 1a, the averaged arterial partial pressure of O2 was constrained to 104 mmHg. Tidal volume took on the following three values: VT= 0.4 l (dashed–dotted line), VT= 0.7 l (dashed line), VT= 1.0 l (continuous line). Only the case of VT= 1.0 l is shown for Model 1a. TI and TE are the inspiration and expiration periods, respectively. The shaded area shows the inspiration period.
Figure 6
Figure 6. Stronger RSA with slow and deep breathing
The optimal heart rate (HR) was calculated for Model 1a (labelled ‘O2’) and Model 1b (remaining three curves). The shaded areas show the inspiration period for each breathing pattern. Only one cycle is shown. The inspired ventilation, qin, is the same for both models (top panel). In Model 1b, the averaged arterial partial pressure of CO2 was constrained to 41 mmHg. In Model 1a, the averaged arterial partial pressure of O2 was constrained to 104 mmHg. Respiratory period and tidal volume were: T= 2.5 s, VT= 0.25 l (dashed–dotted line); T= 5 s, VT= 0.5 l (dashed line); T= 10 s, VT= 1 l (continuous line). The minute ventilation was the same for all simulations: VT/T= 0.1 l s−1= 6 l min−1. Only the case T= 10 s, VT= 1 l is shown for Model 1a.
Figure 8
Figure 8. A saw-tooth HR function used to mimic RSA
The parameter Δ governs the degree of RSA while m is the mean heart rate (HR). Here we took m= 1.2 Hz = 72 beats min−1, Δ= 0.2 Hz = 12 beats min−1. The shaded area shows the inspiration period.
Figure 9
Figure 9. Mimicking pulsatile blood flow (discrete heart rate)
The arterial partial pressure of CO2 (pc, middle panel) and the arterial partial pressure of O2 (po, top panel) are initialized for every heart beat. The heart rate shown here is taken at the minimum of the continuous curve in Fig. 10 with Δ= 0.84 Hz, mean HR = 1.9605 Hz. TI and TE are the inspiration and expiration periods, respectively. The shaded areas show the inspiration period.
Figure 10
Figure 10. A minimum in the work done by the heart is associated with RSA and increases under slow and deep breathing when CO2 is constrained
Simulations are performed with the Ben-Tal (2006) model, using prescribed HR functions. Positive Δ represents RSA, negative Δ represents inverse RSA, constant heart rate is marked by a cross at Δ= 0. E/E0 curves are plotted as functions of Δ (E is calculated with eqn (5), E0 is the value of E at Δ= 0), constraining the partial pressure of CO2 along each curve. Data points are obtained from the simulation, and the continuous lines are least-squares quadratic fits. Data points represented by circles (fitted with a continuous line) were taken with T= 10 s, VT= 1.0 l, constraining the averaged arterial partial pressure of CO2 to 38.7124 mmHg and normalizing E by 39.98 Hz. Squares with a dashed line were taken with T= 5 s, VT= 0.5 l, constraining the averaged arterial partial pressure of CO2 to 38.5611 mmHg and normalizing E by 4.968 Hz. Diamonds with dashed–dotted line were taken with T= 2.5 s, VT= 0.25 l, constraining the averaged arterial partial pressure of CO2 to 38.5004 mmHg and normalizing E by 0.2225 Hz. Triangles with a dotted line were taken with T= 10 s, VT= 1.08 l, constraining the averaged arterial partial pressure of CO2 to 38.5995 mmHg and normalizing E by 62.482 Hz.
Figure 11
Figure 11. Insignificant energy saving when O2 is constrained
Simulations are performed with the Ben-Tal (2006) model, using prescribed HR functions. Positive Δ represents RSA, negative Δ represents inverse RSA, constant heart rate is marked by a cross at Δ= 0. E/E0 curves are plotted as a function of Δ (E is calculated by eqn (5), E0 is the value of E at Δ= 0), constraining the partial pressure of O2 along each curve. Data points are obtained from the simulation, and the continuous lines are least-squares quadratic fits. Data points represented by circles (fitted with a continuous line) were taken with T= 10 s, VT= 1.0 l, constraining the averaged arterial partial pressure of O2 to 105.7143 mmHg and normalizing E by 13.2576 Hz. Squares with a dashed line were taken with T= 5 s, VT= 0.5 l, constraining the averaged arterial partial pressure of O2 to 105.8179 mmHg and normalizing E by 4.974 Hz. Diamonds with dashed–dotted line were taken with T= 2.5 s, VT= 0.25 l, constraining the averaged arterial partial pressure of O2 to 105.1352 mmHg and normalizing E by 1.069 Hz.
Figure 12
Figure 12. Gas exchange efficiency improves with slow and deep breathing and with increased mean heart rate but this is unrelated to RSA
Volumes of O2 (left panels) and CO2 (right panels) taken up or removed by the blood over a minute normalized by the minute ventilation and converted to percentage, calculated with prescribed heart rate functions (shown in Fig. 8). Upper panels are done with human parameters, and for these, data in dark grey (blue online) have T= 10 s, VT= 1 l, data in light grey (red online) have T= 5 s, VT= 0.5 l, and data in black have T= 2.5 s, VT= 0.25 l. The minute ventilation was the same for all these simulations: VT/T= 0.1 l s−1= 6 l min−1. Data represented by circles connected with a continuous line have m= 0.6 Hz, squares with dashed line have m= 1.2 Hz, and diamonds with dashed–dotted line have m= 2.4 Hz. Lower panels are performed with dog parameters, and for these, data in dark grey (blue online) have T= 8 s, VT= 0.42 l, data in light grey (red online) have T= 4 s, VT= 0.21 l, and data in black have T= 2 s, VT= 0.105 l. The minute ventilation was the same for all these simulations: VT/T= 0.1 l s−1= 3.15 l min−1. Data represented by circles connected with a continuous line have m= 0.5 Hz, squares with dashed line have m= 1.0 Hz, and diamonds with dashed–dotted line have m= 2.0 Hz. All other parameters are given in Appendix A.
Figure 13
Figure 13. The calculation of the RSA-like heart rate is not affected qualitatively by changes to the expression of the work done by the heart
The calculations were performed by minimizing formula image 
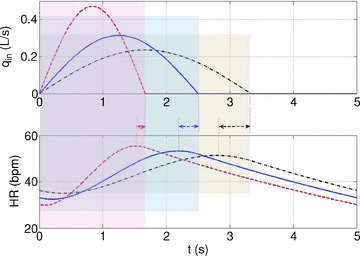
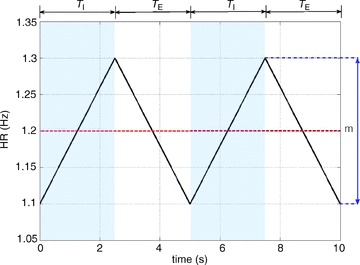
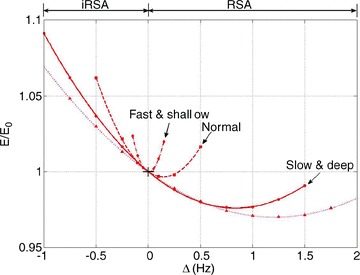
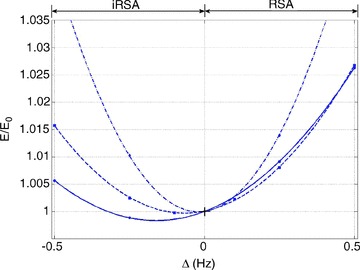
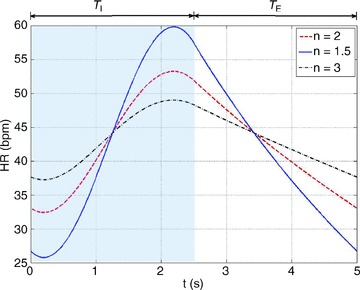
where n= 2 (dashed line), n= 1.5 (continuous line) or n= 3 (dashed–dotted line) and by using Model 1b.

References

    1. Anrep GV, Pascual W, Rossler R. Respiratory variations of the heart rate. II. The central mechanism of the respiratory arrhythmia and the inter-relations between the central and the reflex mechanisms. Proc Royal Soc Lond B Biol Sci. 1936;119:218–230.
    1. Batzel JJ, Schneditz D, Tran TH. Cardiovascular and Respiratory Systems: Modeling, Analysis, and Control. Philadelphia: Society for Industrial and Applied Mathematics; 2007.
    1. Ben-Tal A. Simplified models for gas exchange in the human lungs. J Theor Biol. 2006;238:474–495. - PubMed
    1. Calder WA., 3rd Scaling of physiological processes in homeothermic animals. Annu Rev Physiol. 1981;43:301–322. - PubMed
    1. Cheng L, Ivanova O, Fan H-H, Khoo MCK. An integrative model of respiratory and cardiovascular control in sleep-disordered breathing. Respir Physiol Neurobiol. 2010;174:4–28. - PMC - PubMed

Publication types