Preferential CTL targeting of Gag is associated with relative viral control in long-term surviving HIV-1 infected former plasma donors from China
- PMID: 22290423
- PMCID: PMC3343654
- DOI: 10.1038/cr.2012.19
Preferential CTL targeting of Gag is associated with relative viral control in long-term surviving HIV-1 infected former plasma donors from China
Abstract
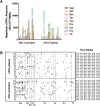
It is generally believed that CD8(+) cytotoxic T lymphocytes (CTLs) play a critical role in limiting the replication of human immunodeficiency virus type 1 (HIV-1) and in determining the outcome of the infection, and this effect may partly depend on which HIV product is preferentially targeted. To address the correlation between HIV-1-specific CTL responses and virus replication in a cohort of former plasma donors (FPDs), 143 antiretroviral therapy naive FPDs infected with HIV-1 clade B' strains were assessed for HIV-1-specific CTL responses with an IFN-γ Elispot assay at single peptide level by using overlapping peptides (OLPs) covering the whole consensus clade B proteome. By using a Spearman's rank correlation analysis, we found that the proportion of Gag-specific CTL responses among the total virus-specific CTL activity was inversely correlated with viral loads while being positively correlated to CD4 counts, as opposed to Pol- and Env-specific responses that were associated with increased viral loads and decreased CD4 counts. In addition, Vpr-specifc CTL responses showed a similar protective effect with Gag responses, but with a much lower frequency of recognition. Significantly, we also observed an association between HLA-A*30/B*13/Cw*06 haplotype and lower viral loads that was probably due to restricted Gag-specific CTL responses. Thus, our data demonstrate the prominent role of Gag-specific CTL responses in disease control. The advantage of HLA-A*30/B*13/Cw*06 haplotype in viral control may be associated with the contribution of Gag-specific CTL responses in the studied individuals.
Figures


Similar articles
-
Association between HIV Type 1-specific T cell responses and CD4+ T cell counts or CD4+:CD8+ T cell ratios in HIV Type 1 subtype B infection in China.AIDS Res Hum Retroviruses. 2006 Aug;22(8):780-7. doi: 10.1089/aid.2006.22.780. AIDS Res Hum Retroviruses. 2006. PMID: 16910834
-
Human immunodeficiency virus type 1 specific cytotoxic T lymphocyte responses in Chinese infected with HIV-1 B'/C Recombinant (CRF07_BC).Retrovirology. 2007 Aug 30;4:62. doi: 10.1186/1742-4690-4-62. Retrovirology. 2007. PMID: 17727734 Free PMC article.
-
Relative dominance of Env-gp41-specific cytotoxic T lymphocytes responses in HIV-1 advanced infection.Curr HIV Res. 2008 May;6(3):239-45. doi: 10.2174/157016208784324921. Curr HIV Res. 2008. PMID: 18473787
-
Multi-layered Gag-specific immunodominant responses contribute to improved viral control in the CRF01_AE subtype of HIV-1-infected MSM subjects.BMC Immunol. 2016 Aug 30;17(1):28. doi: 10.1186/s12865-016-0166-8. BMC Immunol. 2016. PMID: 27577610 Free PMC article.
-
Unique CRF01_AE Gag CTL epitopes associated with lower HIV-viral load and delayed disease progression in a cohort of HIV-infected Thais.PLoS One. 2011;6(8):e22680. doi: 10.1371/journal.pone.0022680. Epub 2011 Aug 3. PLoS One. 2011. PMID: 21826201 Free PMC article.
Cited by
-
Consequences of HLA-B*13-Associated Escape Mutations on HIV-1 Replication and Nef Function.J Virol. 2015 Nov;89(22):11557-71. doi: 10.1128/JVI.01955-15. Epub 2015 Sep 9. J Virol. 2015. PMID: 26355081 Free PMC article.
-
Adenovirus-vectored vaccine containing multidimensionally conserved parts of the HIV proteome is immunogenic in rhesus macaques.Proc Natl Acad Sci U S A. 2021 Feb 2;118(5):e2022496118. doi: 10.1073/pnas.2022496118. Proc Natl Acad Sci U S A. 2021. PMID: 33514660 Free PMC article.
-
Comparison of HIV-1 nef and gag Variations and Host HLA Characteristics as Determinants of Disease Progression among HIV-1 Vertically Infected Kenyan Children.PLoS One. 2015 Aug 28;10(8):e0137140. doi: 10.1371/journal.pone.0137140. eCollection 2015. PLoS One. 2015. PMID: 26317223 Free PMC article.
-
Impaired natural killer cell-induced antibody-dependent cell-mediated cytotoxicity is associated with human immunodeficiency virus-1 disease progression.Clin Exp Immunol. 2013 Jan;171(1):107-16. doi: 10.1111/j.1365-2249.2012.04672.x. Clin Exp Immunol. 2013. PMID: 23199330 Free PMC article.
-
CD8+T-cell response to mutated HLA-B*35-restricted Gag HY9 and HA9 epitopes from HIV-1 variants from Medellin, Colombia.Heliyon. 2024 Jun 15;10(12):e33143. doi: 10.1016/j.heliyon.2024.e33143. eCollection 2024 Jun 30. Heliyon. 2024. PMID: 39027459 Free PMC article.
References
-
- Carrington M, Bontrop RE. Effects of MHC class I on HIV/SIV disease in primates. AIDS. 2002;16 Suppl 4:S105–S114. - PubMed
-
- Carrington M, O'Brien SJ. The influence of HLA genotype on AIDS. Annu Rev Med. 2003;54:535–551. - PubMed
-
- Riviere Y, McChesney MB, Porrot F, et al. Gag-specific cytotoxic responses to HIV type 1 are associated with a decreased risk of progression to AIDS-related complex or AIDS. AIDS Res Hum Retroviruses. 1995;11:903–907. - PubMed
Publication types
MeSH terms
Substances
Grants and funding
LinkOut - more resources
Full Text Sources
Other Literature Sources
Medical
Research Materials

