. 2012 Apr;32(7):1237-47.
doi: 10.1128/MCB.06257-11. Epub 2012 Jan 30.

Phosphorylation of BRN2 modulates its interaction with the Pax3 promoter to control melanocyte migration and proliferation

Affiliations

Phosphorylation of BRN2 modulates its interaction with the Pax3 promoter to control melanocyte migration and proliferation

Irina Berlin et al. Mol Cell Biol. 2012 Apr.

Abstract

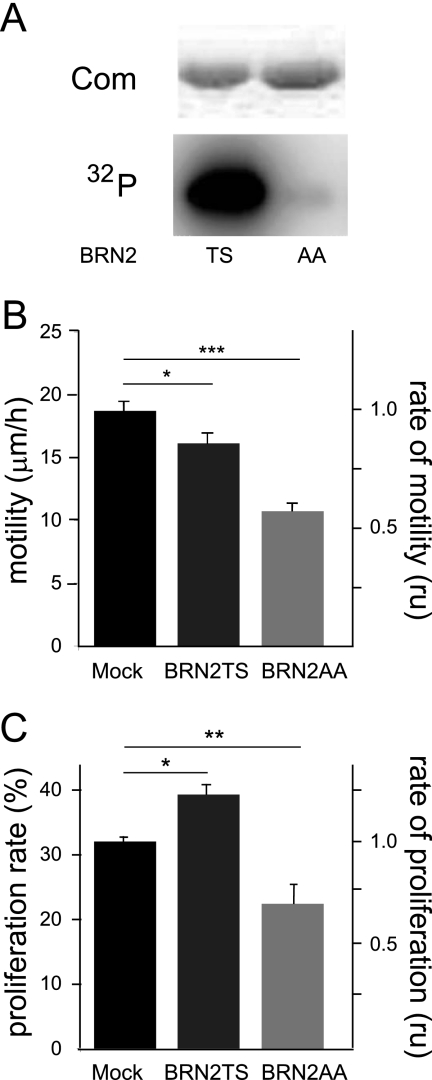
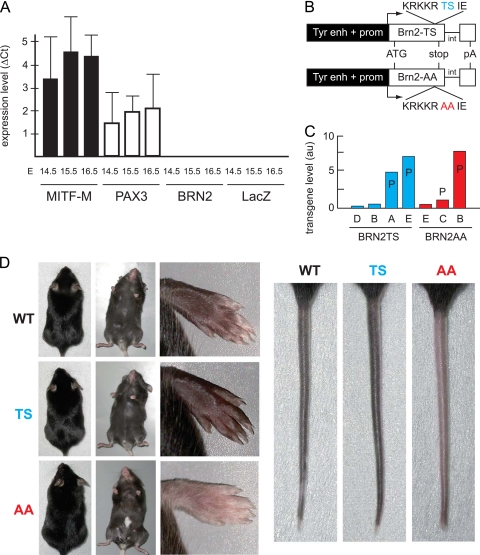
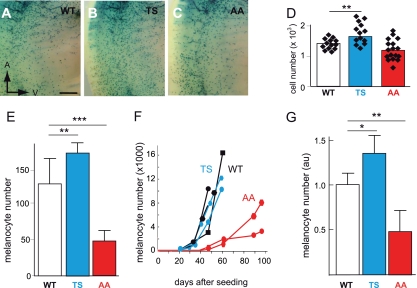
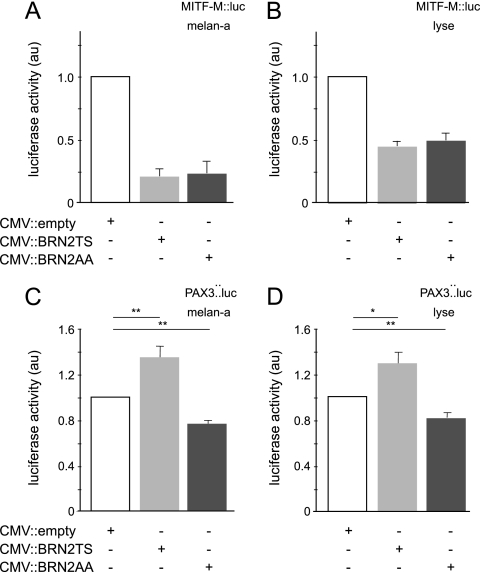
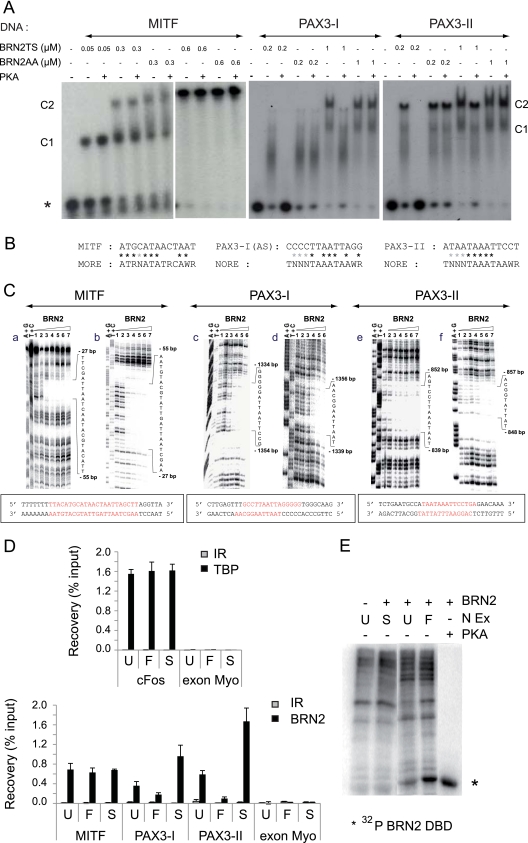
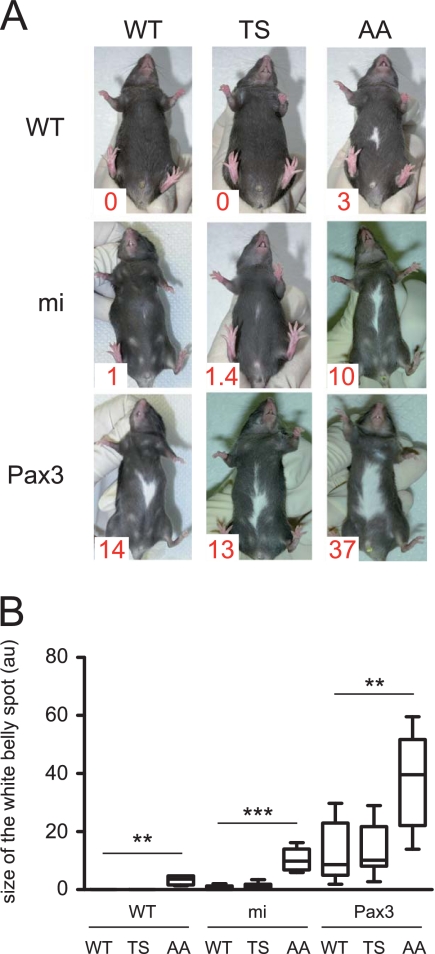
MITF-M and PAX3 are proteins central to the establishment and transformation of the melanocyte lineage. They control various cellular mechanisms, including migration and proliferation. BRN2 is a POU domain transcription factor expressed in melanoma cell lines and is involved in proliferation and invasion, at least in part by regulating the expression of MITF-M and PAX3. The T361 and S362 residues of BRN2, both in the POU domain, are conserved throughout the POU protein family and are targets for phosphorylation, but their roles in vivo remain unknown. To examine the role of this phosphorylation, we generated mutant BRN2 in which these two residues were replaced with alanines (BRN2TS→BRN2AA). When expressed in melanocytes in vitro or in the melanocyte lineage in transgenic mice, BRN2TS induced proliferation and repressed migration, whereas BRN2AA repressed both proliferation and migration. BRN2TS and BRN2AA bound and repressed the MITF-M promoter, whereas PAX3 transcription was induced by BRN2TS but repressed by BRN2AA. Expression of the BRN2AA transgene in a Mitf heterozygous background and in a Pax3 mutant background enhanced the coat color phenotype. Our findings show that melanocyte migration and proliferation are controlled both through the regulation of PAX3 by nonphosphorylated BRN2 and through the regulation of MITF-M by the overall BRN2 level.


Figures

Fig 1
Fig 1
Phosphorylation of BRN2 affects cell migration and proliferation in cellulo. (A) Analysis of BRN2 phosphorylation profile. BRN2TS and BRN2AA were produced in bacteria, purified, and incubated with [γ-32P]ATP in the presence of purified PKA. The proteins were analyzed by SDS-PAGE. Com, Coomassie staining. (B) In cellulo motility of murine melan-a melanocytes. Cells were transfected with GFP-coupled BRN2TS and BRN2AA expression vectors. The empty GFP expression vector (Mock) was used as a control. Forty-eight hours after transfection, the cells were subjected to a single-cell migration assay using two-dimensional video microscopy for 12 h and cell motility was determined. Each experiment was performed at least three times. The migration speeds were calculated as means ± standard deviations using Excel (Microsoft). Student's t test was used to compare migration speeds between groups. *, P < 0.01; ***, P < 0.001. (C) The cell proliferation rates of Lyse melanoma cells after 48 h of BRN2TS and BRN2AA expression were estimated by following BrdU incorporation into transfected cells over 2 h. Experiments were performed at least three times. The proliferation rates were calculated as means ± standard deviations using Excel (Microsoft). Student's t test was used to compare migration speeds. *, P < 0.01; **, P < 0.005. Similar results were obtained with all of the cell lines tested.
Fig 2
Fig 2
BRN2TS mice are hyperpigmented, and BRN2AA mice are hypopigmented. (A) BRN2 is not produced in melanoblasts during embryonic development. Skin melanoblasts were isolated, as enhanced-GFP-positive cells, by fluorescence-activated cell sorter from Tyr::Cre/°; ZEG/ZEG mice from E14.5 to E16.5. RNA was extracted, and qRT-PCR was used to assay the mRNAs of endogenous MITF-M, PAX3, BRN2, and LacZ using HPRT as an internal reference. The experiments were performed four or five times for each embryonic stage. For each stage, three Tyr::Cre/°; ZEG/ZEG embryos were used. Tyr::Cre/°; °/° and °/°; ZEG/ZEG embryos do not produce any enhanced GFP (not shown). Note that LacZ was used as internal control and nondefloxed cells produce this reporter mRNA. qRT-PCR with C57BL/6 mouse brain samples was used as a positive control for BRN2 (not shown). (B) Map of the Tyr::BRN2TS and Tyr::BRN2AA transgenes. int, intron of SV40; enh, enhancer; prom, promoter; pA, polyadenylation site of SV40. (C) Expression of BRN2TS or BRN2AA in various Tyr::BRN2 transgenic mouse lines. P indicates that the mice of these lines present a phenotype. The transgenes were similarly strongly expressed in Tyr::BRN2TS-E and Tyr::BRN2AA-B mice. These two lines are directly compared with each other. au, arbitrary unit. (D) Phenotype of WT, Tyr::BRN2TS-E (TS), and Tyr::BRN2AA-B (AA) mice. The mice do not present any phenotype on the dorsal side. On the ventral side, AA mice present a white belly spot. The paws and tails of TS mice are darker and those of AA mice are lighter than those of WT mice. The gray intensity of paws and tails was estimated (arbitrary relative scale) as 1 and 1 in WT mice, as 1.2 and 1.1 in Tyr::BRN2TS mice, and as 0.6 and 0.8 in Tyr::BRN2AA mice, respectively.
Fig 3
Fig 3
In vivo melanoblast proliferation is induced by BRN2TS and repressed by BRN2AA. (A to D) Number of melanoblasts in WT-Lac, BRN2TS-LacZ (TS), and BRN2AA-LacZ (AA) embryos at E13.5 in the trunk region between the front and back limbs, from somites 13 to 25. Melanoblasts were genetically labeled using Dct::LacZ and identified by eye as X-Gal-positive cells. The number of melanoblasts was estimated to be 1,388 ± 183 for WT embryos (14 independent embryo sides), 1,750 ± 350 for TS embryos (14 independent embryo sides), and 1,201 ± 340 for AA embryos (17 independent embryo sides). The P value is 0.003 for WT versus TS mice (**) and 0.08 for WT versus AA mice. The anterior (A) and ventral (V) orientations of embryos are indicated in panel A. Note that the intensity of X-Gal staining is similar in WT and mutant melanoblasts and that the level of expression of Dct is slightly affected, but it is not for Tyr and Tyrp1, by the expression of BRN2TS or BRN2AA (see Fig. S7 at the URL mentioned in the introduction) (E) Numbers of WT, TS, and AA melanocytes 5 days after the explantation of newborn skin. Similar numbers of cells isolated from the skin of 3-day-old pups were grown in culture. The number of melanocytes was estimated in six independent cultures of cells from WT pups, four independent cultures of cells from TS pups, and eight independent cultures of cells from AA pups. StatView software was used for statistical analysis. **, P < 0.01; ***, P < 0.001. (F) Primary melanocyte growth curves. Melanocytes were established in culture from two independent WT (black), two independent TS (blue), and two independent AA (red) new born pups, and growth curves were determined from the numbers of pigmented cells. Each point is derived from the mean count of melanocytes from duplicate dishes. On day zero, 106 cells containing a mixture of melanocytes, keratinocytes, and fibroblasts were seeded for each WT, TS, and AA mouse. (G) Numbers of X-Gal-positive cells estimated from at least three independent WT-LacZ, TS-LacZ, and AA-LacZ tails. au, arbitrary units. StatView software was used for statistical analysis: *, P < 0.05; **, P < 0.01.
Fig 4
Fig 4
BRN2TS and BRN2AA have different effects on the PAX3 promoter, but not on the MITF-M promoter. melan-a (A and C) and Lyse (B and D) cells were transfected with a control (CMV::empty) or a CMV::BRN2TS or CMV::BRN2AA expression vector and a MITF-M::luciferase (A and B) or a PAX3::luciferase (C and D) reporter vector. StatView software was used for statistical analysis. *, P < 0.05; **, P < 0.01. au, arbitrary unit.
Fig 5
Fig 5
The nonphosphorylated form of BRN2 binds NORE elements in the PAX3 promoter, and phosphorylated/nonphosphorylated forms of BRN2 bind MORE elements in the MITF-M promoter. (A) BRN2 phosphorylation reduced its affinity for PAX3 but not for MITF-M targets in vitro. Radioactively labeled probes (10 nM) MITF-M, PAX3-I, and PAX3-II were incubated with various concentrations of recombinant BRN2TS or BRN2AA protein pretreated with PKA or not pretreated. Samples were analyzed by nondenaturing 8% acrylamide gel electrophoresis. Results are representative of at least three independent experiments. Under our conditions, the protein was bound to NORE and MORE sequences as monomers (C1) and as dimers (C2). The phosphorylation of BRN2TS and BRN2AA by PKA was evaluated for each independent experiment by mass spectrometry (not shown) and indirectly as shown in Fig. 1A. The asterisk indicates the labeled free probe. (B) The BRN2-binding sequences in the MITF-M and PAX3 promoters match degenerate MORE and NORE sequences. Asterisks indicate matches. (C) DNase I footprinting analysis of the BRN2-DNA interaction indicates that the MITF-M target is a MORE sequence whereas the PAX3 targets are NORE sequences. Autoradiograms of 12% polyacrylamide denaturing gels showing the DNase I footprints on the sense (a, c, and e) and complementary (b, d, and f) strands of one MITF-M and two PAX3 promoter fragments. Lanes A+G and T+C, Maxam-Gilbert chemical sequencing references. Lane 1, free DNA cleavage products. Lanes 2 to 7, purified BRN2 protein at 1, 5, 20, 50, 75, and 225 nM, respectively. Sequences of the MITF-M and PAX3 promoters with the BRN2-binding sites in red. (D) ChIP assays of BRN2 binding to the Mitf and Pax3 promoters. Lyse melanoma cells were either left untreated (U) or treated with forskolin to induce PKA (F) or with staurosporine to repress PKA (S). The samples were subjected to ChIP assays with antibodies against BRN2 or TBP or irrelevant (IR) antibodies and analyzed by qRT-PCR using primers specifically encompassing the BRN2-binding site. The c-fos promoter was used to normalize the assay, and a myoglobin exon was used as a negative control. All of the data shown are representative of a minimum of three independent assays. (E) Forskolin (F) and staurosporine (S) control the level of phosphorylation of BRN2. In the presence of [γ-32P]ATP, the BRN2 DBD produced from E. coli (BRN2) was incubated with nuclear extracts (N Ex) obtained from Lyse melanoma cells, which were either left untreated (U) or treated with forskolin or staurosporine. Phosphorylation of the BRN2 DBD by purified PKA was used as a positive control. Untreated N Ex lacking the BRN2 DBD was used as a negative control. The radiolabeled proteins were analyzed by 12% SDS-PAGE and autoradiography. Phosphorylation of the BRN2 DBD was highest when the cells were treated with forskolin and lowest when the cells were treated with staurosporine.
Fig 6
Fig 6
BRN2 cooperates with MITF and PAX3 to determine the size of the white belly spot in vivo. (A) WT, Tyr::BRN2TS/° (TS), and Tyr::BRN2AA/° (AA) mice were crossed with Mitfmiva9/+ (mi) or Pax3IRESnLacZ/+ (Pax3) mice. The area of the white spot was determined as a percentage of the total area of the belly with ImageJ software and is expressed in arbitrary units (au); 100 au means that the entire belly is white, and 0 au means that the entire belly is black. The mean area of the white belly spot is shown in red at the bottom left corner of each photograph. (B) Box-and-whisker plot of white belly spot sizes. Each horizontal bar represents the median, and the limits of each rectangle correspond to the first and third quartiles. The ends of the error bars represent the 5th and 95th centiles. **, P < 0.01; ***, P < 0.001.

Similar articles

Cited by

References

    1. Abdel-Malek ZA, et al. 2001. The melanocortin 1 receptor is the principal mediator of the effects of agouti signaling protein on mammalian melanocytes. J. Cell Sci. 114:1019–1024 - PubMed
    1. Alazard R, et al. 2005. Identification of the ‘NORE’ (N-Oct-3 responsive element), a novel structural motif and composite element. Nucleic Acids Res. 33:1513–1523 - PMC - PubMed
    1. Andersen B, Rosenfeld MG. 2001. POU domain factors in the neuroendocrine system: lessons from developmental biology provide insights into human disease. Endocr. Rev. 22:2–35 - PubMed
    1. Arozarena I, et al. 2011. Oncogenic BRAF Induces Melanoma Cell Invasion by Downregulating the cGMP-Specific Phosphodiesterase PDE5A. Cancer Cell 19:45–57 - PubMed
    1. Augustijn KD, et al. 2002. Structural characterization of the PIT-1/ETS-1 interaction: PIT-1 phosphorylation regulates PIT-1/ETS-1 binding. Proc. Natl. Acad. Sci. U. S. A. 99:12657–12662 - PMC - PubMed

Publication types

MeSH terms

LinkOut - more resources