

Annual summary of vital statistics: 2009
- PMID: 22291121
- PMCID: PMC4079290
- DOI: 10.1542/peds.2011-3435
Annual summary of vital statistics: 2009
Abstract
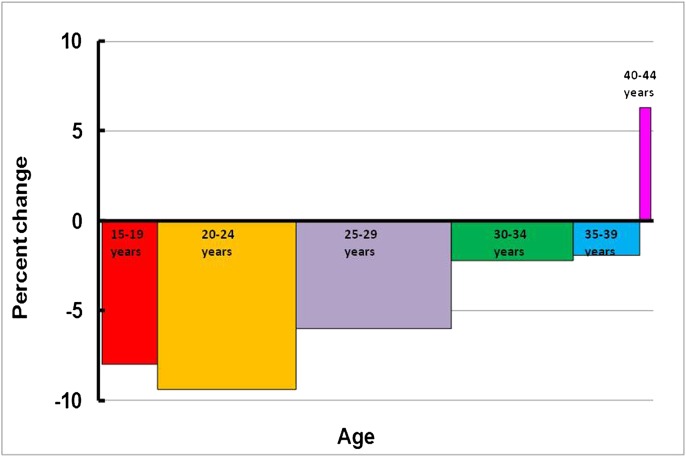
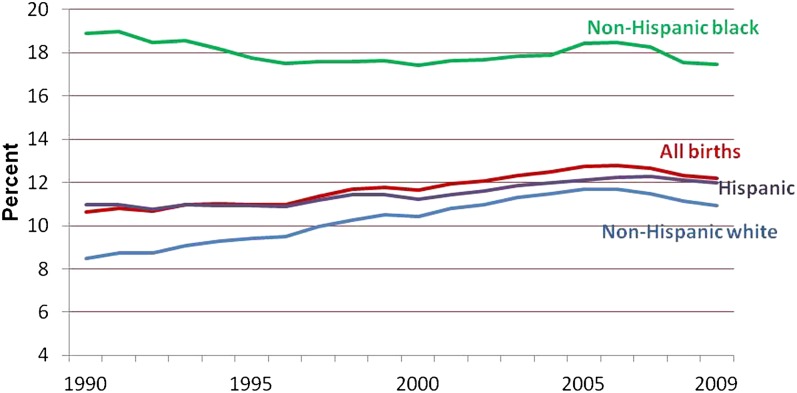
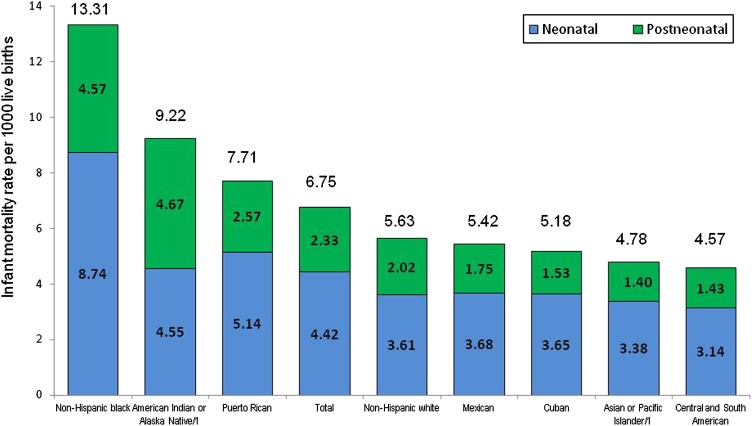
The number of births in the United States decreased by 3% between 2008 and 2009 to 4 130 665 births. The general fertility rate also declined 3% to 66.7 per 1000 women. The teenage birth rate fell 6% to 39.1 per 1000. Birth rates also declined for women 20 to 39 years and for all 5-year groups, but the rate for women 40 to 44 years continued to rise. The percentage of all births to unmarried women increased to 41.0% in 2009, up from 40.6% in 2008. In 2009, 32.9% of all births occurred by cesarean delivery, continuing its rise. The 2009 preterm birth rate declined for the third year in a row to 12.18%. The low-birth-weight rate was unchanged in 2009 at 8.16%. Both twin and triplet and higher order birth rates increased. The infant mortality rate was 6.42 infant deaths per 1000 live births in 2009. The rate is significantly lower than the rate of 6.61 in 2008. Linked birth and infant death data from 2007 showed that non-Hispanic black infants continued to have much higher mortality rates than non-Hispanic white and Hispanic infants. Life expectancy at birth was 78.2 years in 2009. Crude death rates for children and adolescents aged 1 to 19 years decreased by 6.5% between 2008 and 2009. Unintentional injuries and homicide, the first and second leading causes of death jointly accounted for 48.6% of all deaths to children and adolescents in 2009.
Figures
References
-
- Martin JA, Hamilton BE, Ventura SJ, et al. Births: final data for 2009. Natl Vital Stat Rep. 2011;60(1):1–104 - PubMed
-
- Martin JA, Hamilton BE, Sutton PD, et al. Births: final data for 2008. Natl Vital Stat Rep. 2010;59(1):1–72 - PubMed
-
- Kochanek KD, Xu J, Murphy SL, et al. Deaths: preliminary data for 2009. Natl Vital Stat Rep. 2011;59(4):1–51 - PubMed
-
- Miniňo AM, Murphy SL, Xu J, et al. Deaths: final data for 2008. Natl Vital Stat Rep. 2011;59(10):1–157 - PubMed
-
- National Center for Health Statistics. Natality public use file and CD-ROM. Hyattsville, MD: National Center for Health Statistics. Published annually. Available at: www.cdc.gov/nchs/data_access/VitalStatsOnline.htm. Accessed September 19, 2011
MeSH terms
Grants and funding
LinkOut - more resources
Full Text Sources
