. 2012 Apr;63(7):2769-86.
doi: 10.1093/jxb/err463. Epub 2012 Jan 30.

Translatome and metabolome effects triggered by gibberellins during rosette growth in Arabidopsis

Affiliations

Translatome and metabolome effects triggered by gibberellins during rosette growth in Arabidopsis

Dimas M Ribeiro et al. J Exp Bot. 2012 Apr.

Abstract

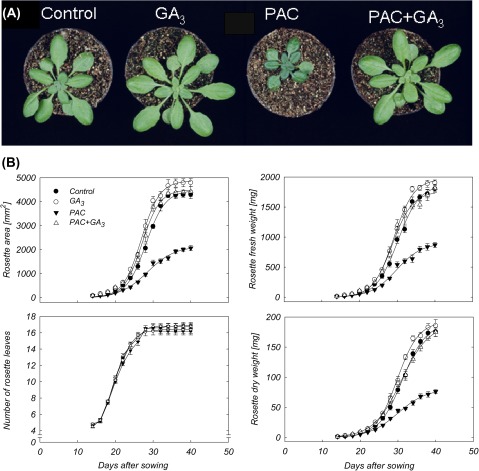
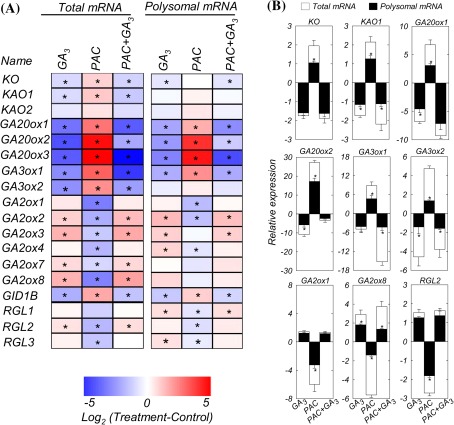
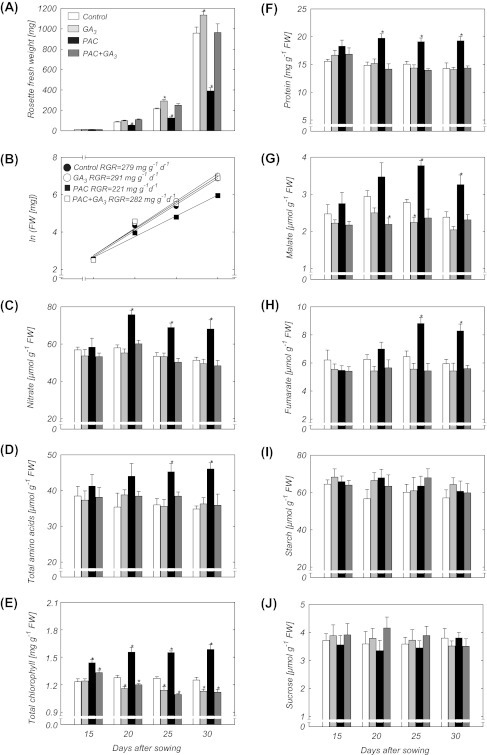
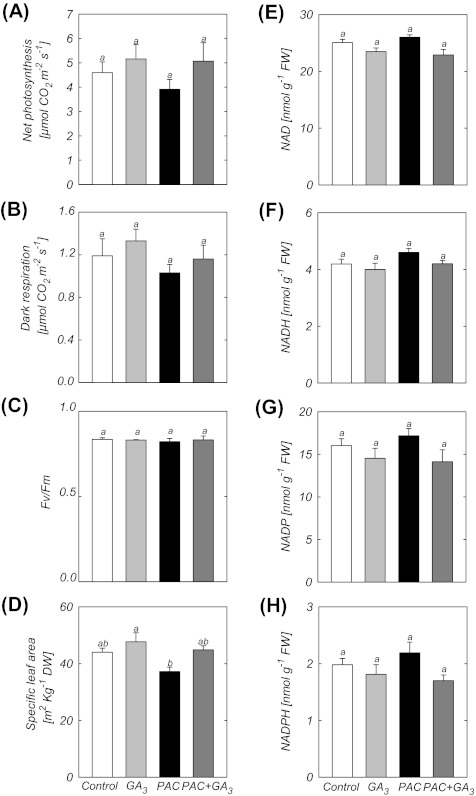
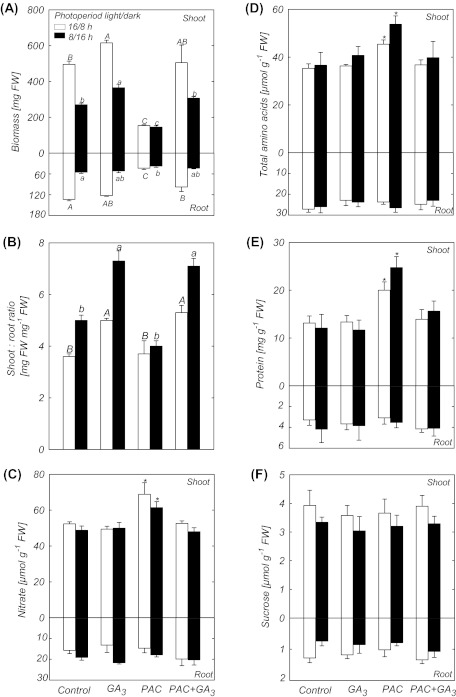
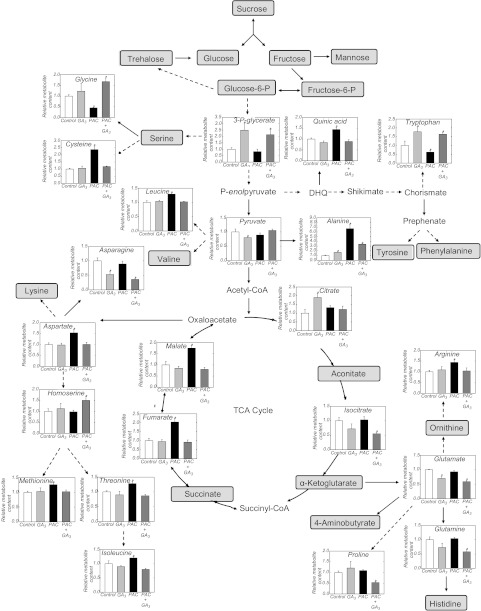
Although gibberellins (GAs) are well known for their growth control function, little is known about their effects on primary metabolism. Here the modulation of gene expression and metabolic adjustment in response to changes in plant (Arabidopsis thaliana) growth imposed on varying the gibberellin regime were evaluated. Polysomal mRNA populations were profiled following treatment of plants with paclobutrazol (PAC), an inhibitor of GA biosynthesis, and gibberellic acid (GA(3)) to monitor translational regulation of mRNAs globally. Gibberellin levels did not affect levels of carbohydrates in plants treated with PAC and/or GA(3). However, the tricarboxylic acid cycle intermediates malate and fumarate, two alternative carbon storage molecules, accumulated upon PAC treatment. Moreover, an increase in nitrate and in the levels of the amino acids was observed in plants grown under a low GA regime. Only minor changes in amino acid levels were detected in plants treated with GA(3) alone, or PAC plus GA(3). Comparison of the molecular changes at the transcript and metabolite levels demonstrated that a low GA level mainly affects growth by uncoupling growth from carbon availability. These observations, together with the translatome changes, reveal an interaction between energy metabolism and GA-mediated control of growth to coordinate cell wall extension, secondary metabolism, and lipid metabolism.


Figures

Fig. 1.
Fig. 1.
Phenotypic changes of 35S::HF-RPL18 Arabidopsis plants caused by treatment with PAC and/or GA3. (A) Shoots of 27-day-old plants. (B) Time course of rosette growth of plants treated with PAC and/or GA3. Rosette growth was described by the sigmoidal function y = A/(1+exp {–[(x–x0)/b]}). Values are presented as means ±SE of 10 individual determinations.
Fig. 2.
Fig. 2.
Changes in gene expression in shoots of Arabidopsis plants treated with PAC and/or GA3, relative to control. (A) Heat map. Different shades of red and blue express the extent of the change according to the colour bar provided (log2 ratio of control); white indicates no change. Asterisks indicate values determined by the Student’s t-test to be significantly different from the control (P < 0.05). For absolute values, see Supplementary Table S2 at JXB online. Primer sequences are given in Supplementary Table S5. (B) Relative expression of genes selected from the heat map. Data represent means ±SE of three independent replicates (each replicate is a pool of five plants). Asterisks indicate a significant difference in gene expression between non-polysomal and polysomal fractions, as determined by the Student’s t-test (P < 0.05).
Fig. 3.
Fig. 3.
Developmental changes of biomass and major metabolites in shoots of Arabidopsis plants treated with PAC and/or GA3. (A) Rosette fresh weight. (B) Relative growth rate over vegetative development. (C) Nitrate. (D) Total amino acids. (E) Total chlorophyll. (F) Protein. (G) Malate. (H) Fumarate. (I) Starch. (J) Sucrose. Data are means ±SE of six replicates (each replicate is a pool of five plants). Asterisks indicate values determined by the Student’s t-test to be significantly different from the control (P < 0.05).
Fig. 4.
Fig. 4.
Physiological analysis of plants treated with PAC and/or GA3. (A) Rate of photosynthesis. (B) Dark respiration. (C) Fv/Fm. (D) Specific leaf area. Values are presented as means ±SE of 10 individual determinations. (E–H) NAD(P)H levels. Bars labelled with the same letter are not statistically different at the 5% level (Tukey test). Data are means ±SE of six replicates (each replicate is a pool of five plants).
Fig. 5.
Fig. 5.
Comparison of the growth response and metabolite levels in shoots and roots of plants treated with PAC and/or GA3 in long and short photoperiods. (A) Biomass. (B) Shoot-to-root ratio. (C) Nitrate. (D) Total amino acids. (E) Protein. (F) Sucrose. Bars followed by the same upper case letter (long day) or followed by the same lower case letter (short day) do not differ significantly at the 5% level (Tukey test). Asterisks indicate values determined by the Student’s t-test to be significantly different from control (P < 0.05). Values are presented as means of six replicates (each replicate is a pool of five plants) ±SE.
Fig. 6.
Fig. 6.
Changes in metabolite profiles in shoots of plants treated with PAC and/or GA3. Metabolites without a significant difference between treatments are indicated by a grey square. Metabolites outside grey squares indicate that they were not measured. Continuous arrows indicate a one-step reaction, and broken arrows indicate a series of biochemical reactions. Values are presented as means of six replicates (each replicate is a pool of five plants) ±SE. Asterisks indicate values determined by the Student’s t-test to be significantly different from control (P < 0.05). DHQ, 3-dehydroquinate. A complete list of all metabolites measured by GC-MS can be found in Supplementary Table S3 at JXB online.

References

    1. Achard P, Cheng H, De Grauwe L, Decat J, Schoutteten H, Moritz T, Van Der Straeten D, Peng J, Harberd NP. Integration of plant responses to environmentally activated phytohormonal signals. Science. 2006;311:91–94. - PubMed
    1. Araújo WL, Nunes-Nesi A, Fernie AR. Fumarate: multiple functions of a simple metabolite. Phytochemistry. 2011;72:838–843. - PubMed
    1. Arvidsson S, Kwasniewski M, Riano-Pachon DM, Mueller-Roeber B. QuantPrime—a flexible tool for reliable high-throughput primer design for quantitative PCR. BMC Bioinformatics. 2008;9:465. - PMC - PubMed
    1. Balazadeh S, Riaño-Pachón DM, Mueller-Roeber B. Transcription factors regulating leaf senescence in Arabidopsis thaliana. Plant Biology. 2008;(Suppl. 1):63–75. - PubMed
    1. Benjamini Y, Hochberg Y. Controlling the false discovery rate: a practical and powerful approach to multiple testing. Journal of the Royal Statistical Society B. 1995;57:289–300.

Publication types

MeSH terms