. 2012 Mar 13;370(1962):1185-204.
doi: 10.1098/rsta.2011.0304.

Early warning of climate tipping points from critical slowing down: comparing methods to improve robustness

Affiliations

Early warning of climate tipping points from critical slowing down: comparing methods to improve robustness

T M Lenton et al. Philos Trans A Math Phys Eng Sci. .

Abstract

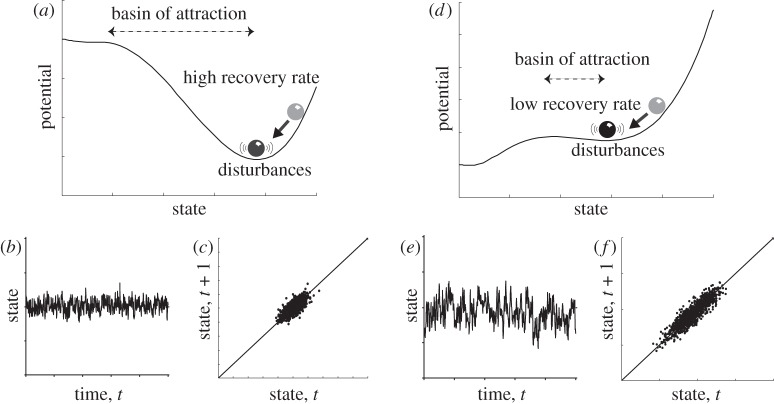
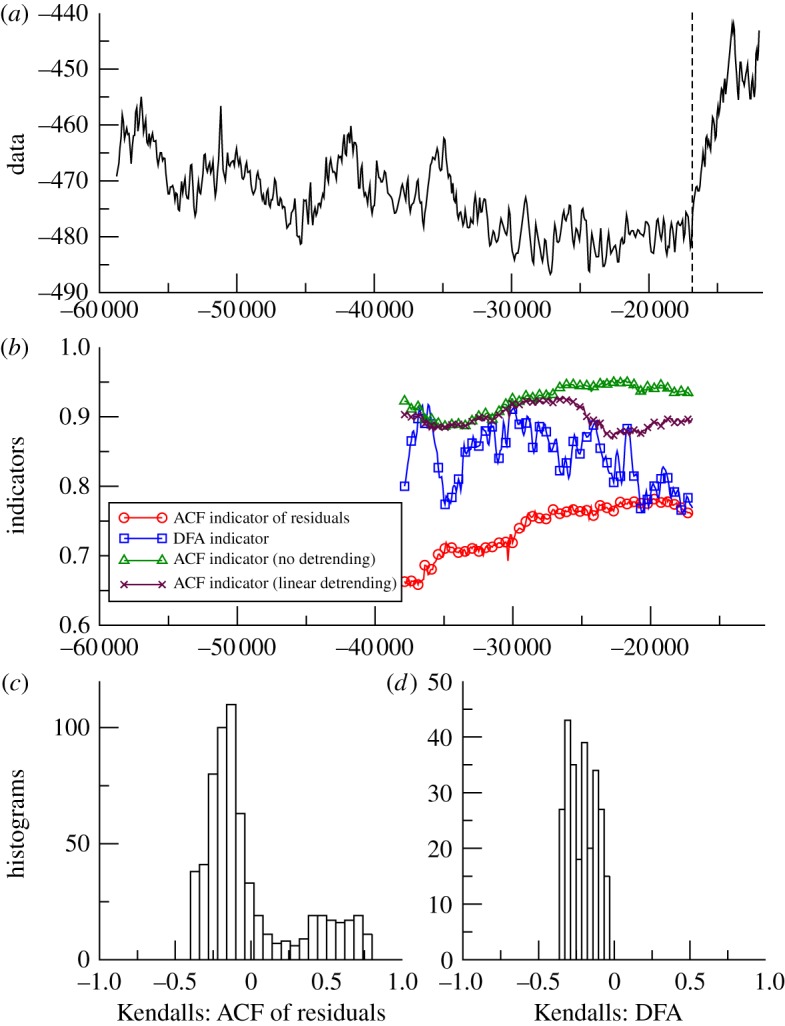
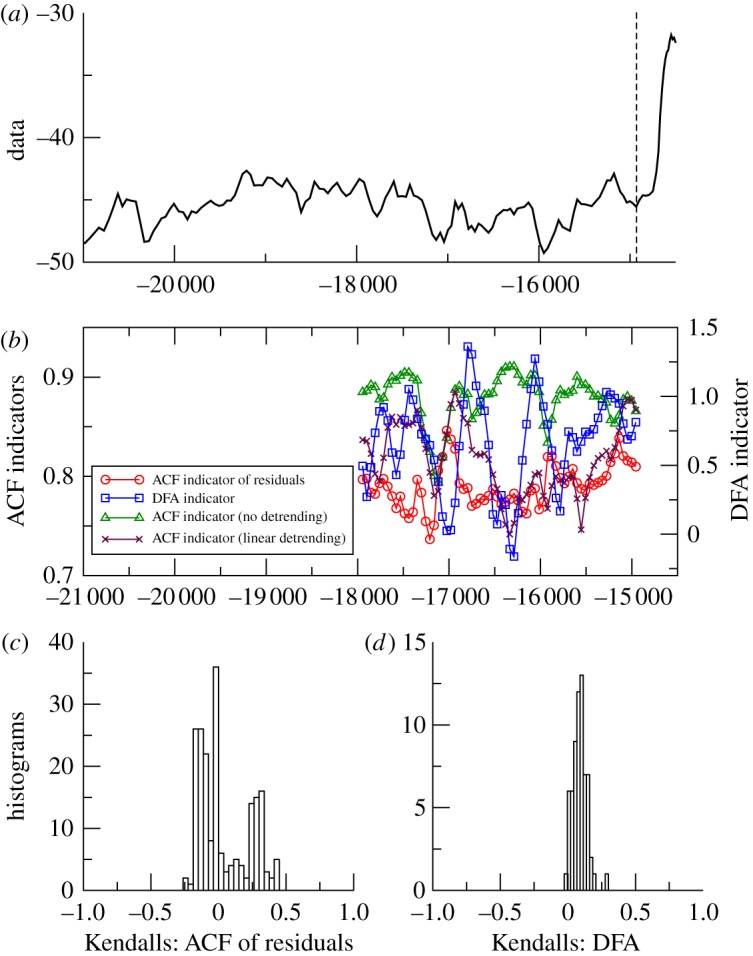
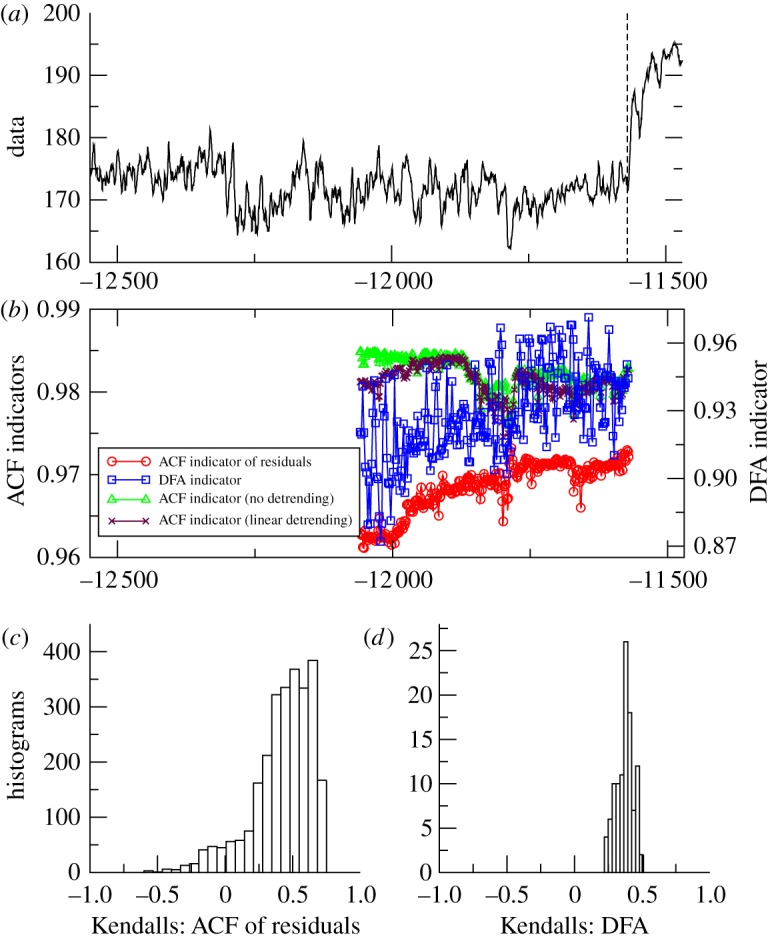
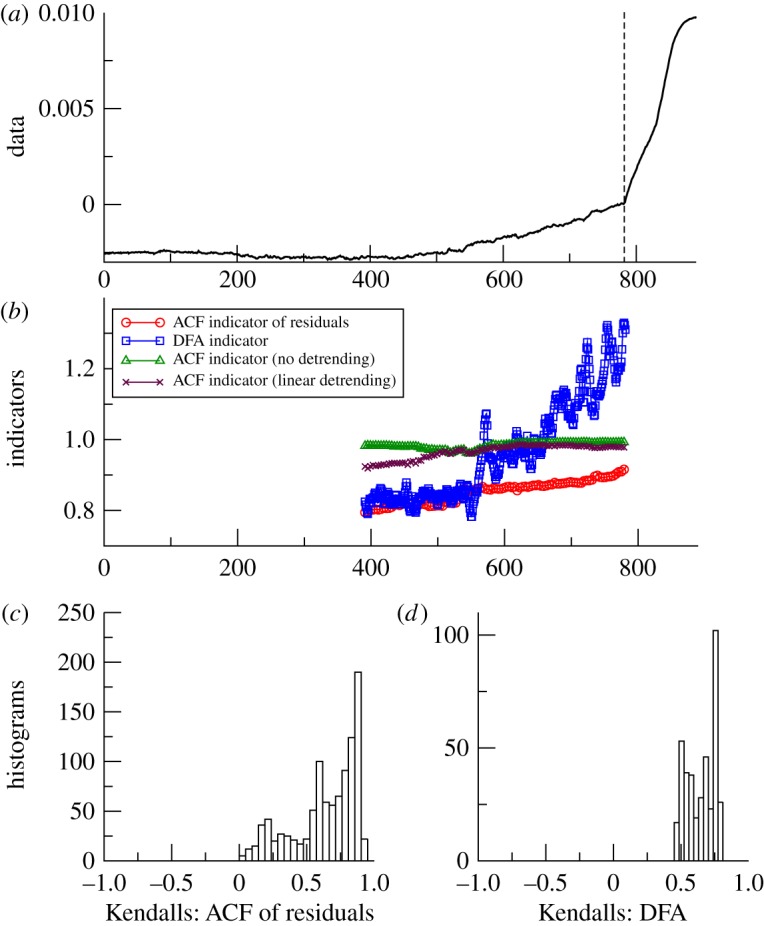
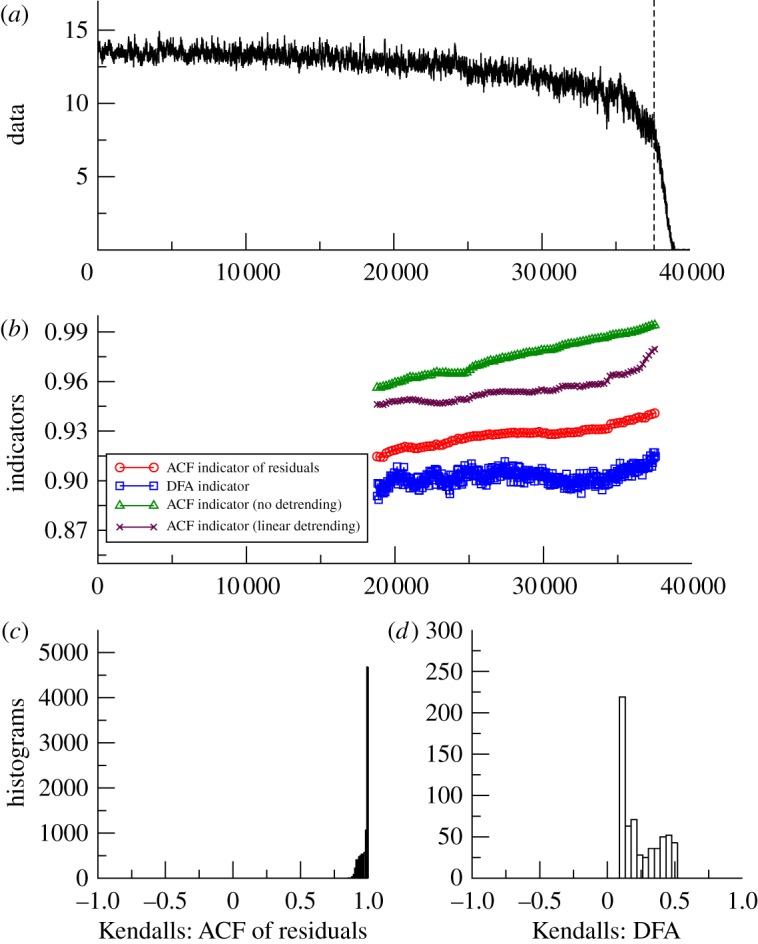
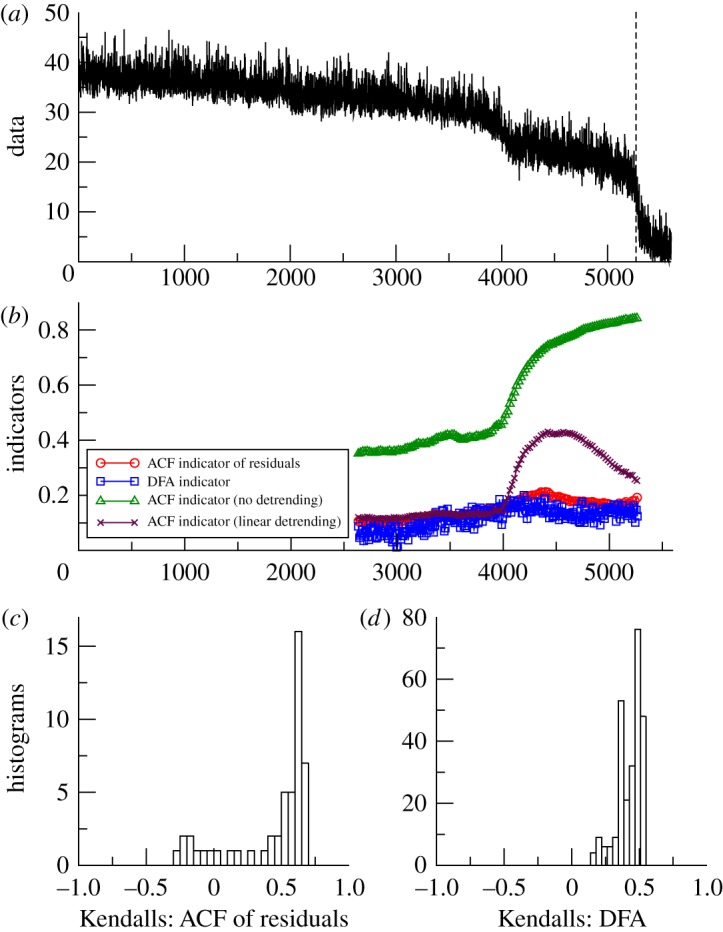
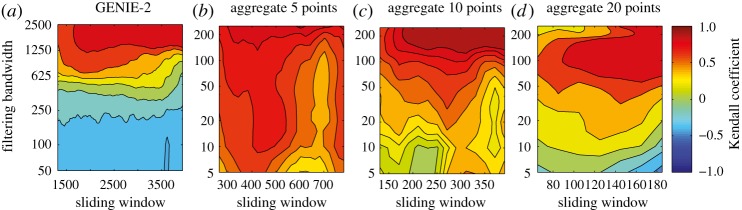
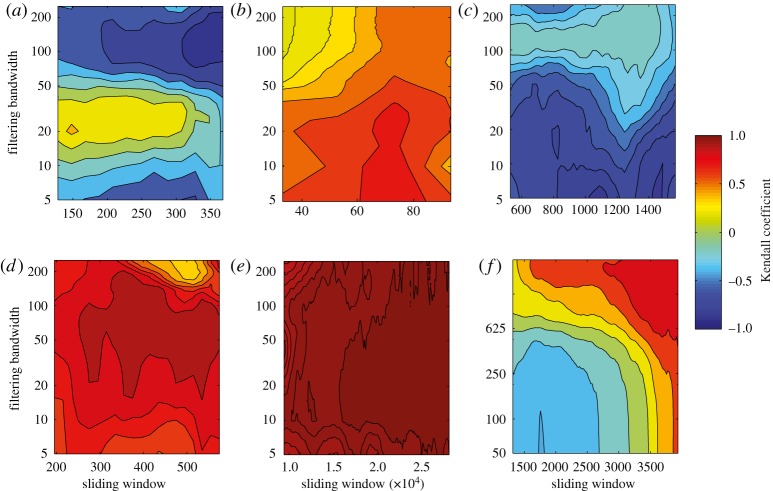
We address whether robust early warning signals can, in principle, be provided before a climate tipping point is reached, focusing on methods that seek to detect critical slowing down as a precursor of bifurcation. As a test bed, six previously analysed datasets are reconsidered, three palaeoclimate records approaching abrupt transitions at the end of the last ice age and three models of varying complexity forced through a collapse of the Atlantic thermohaline circulation. Approaches based on examining the lag-1 autocorrelation function or on detrended fluctuation analysis are applied together and compared. The effects of aggregating the data, detrending method, sliding window length and filtering bandwidth are examined. Robust indicators of critical slowing down are found prior to the abrupt warming event at the end of the Younger Dryas, but the indicators are less clear prior to the Bølling-Allerød warming, or glacial termination in Antarctica. Early warnings of thermohaline circulation collapse can be masked by inter-annual variability driven by atmospheric dynamics. However, rapidly decaying modes can be successfully filtered out by using a long bandwidth or by aggregating data. The two methods have complementary strengths and weaknesses and we recommend applying them together to improve the robustness of early warnings.


Figures

Figure 1.
Figure 1.
Heuristic illustration of critical slowing down. Panels show characteristic changes in non-equilibrium dynamics as a system approaches a tipping point (catastrophic bifurcation). (ac) Far from the tipping point (a), the basin of attraction is steep and the rate of recovery from perturbations is relatively high, such that if the system is stochastically forced (b), the resulting dynamics are characterized by (c) low correlation between the states at subsequent time intervals and low variance. (df) When the system is closer to the tipping point (d), the basin of attraction shallows and the rate of recovery from small perturbations is lower, such that if the system is stochastically forced (e), the resulting dynamics are characterized by (f) a stronger correlation between subsequent states and a larger variance. (Adapted from Scheffer et al. [4].)
Figure 2.
Figure 2.
Search for early warning of the last deglaciation as seen in Antarctica. (a) Vostok deuterium proxy for local temperature 58.8–17 kyr BP (n=513). Analysis stops at the vertical dashed line before the termination occurs. (b) Example of early warning indicators from autocorrelation function (ACF) with various detrending methods, or detrended fluctuation analysis (DFA); results plotted at the end of the windows (sliding window length of half the data series in all cases, bandwidth = 25 for ACF method). (c) Histogram of the frequency distribution of the Kendall trend statistic for the ACF of residuals indicator, when varying the sliding window length and filtering bandwidth. (d) Histogram of the frequency distribution of the Kendall trend statistic for the DFA indicator, when varying the sliding window length. (Online version in colour.)
Figure 3.
Figure 3.
Search for early warning of the Bølling-Allerød transition as seen in Greenland. (a) GISP2 δ18O proxy for local temperature, 21.0–14.8 kyr BP (n= 132) [9]. Analysis stops at the vertical dashed line before the transition into the Bølling-Allerød warm interval. (b) Example of early warning indicators from autocorrelation function (ACF) with various detrending methods (left-hand scale), or detrended fluctuation analysis (DFA, right-hand scale); results plotted at the end of the windows (sliding window length of half the data series in all cases, bandwidth=25 for ACF method). (c) Histogram of the frequency distribution of the Kendall trend statistic for the ACF of residuals indicator, when varying the sliding window length and filtering bandwidth. (d) Histogram of the frequency distribution of the Kendall trend statistic for the DFA indicator, when varying the sliding window length. (Online version in colour.)
Figure 4.
Figure 4.
Search for early warning of the end of the Younger Dryas in the tropical Atlantic. (a) Cariaco basin core PL07-58PC greyscale proxy for local productivity, 12.5–11.6 kyr BP (n=2111). Analysis stops at the vertical dashed line before the transition into the Holocene. (b) Example of early warning indicators from autocorrelation function (ACF) with various detrending methods (left-hand scale), or detrended fluctuation analysis (DFA, right-hand scale); results plotted at the end of the windows (sliding window length of half the data series in all cases, bandwidth = 100 for ACF method). (c) Histogram of the frequency distribution of the Kendall trend statistic for the ACF of residuals indicator, when varying the sliding window length and filtering bandwidth. (d) Histogram of the frequency distribution of the Kendall trend statistic for the DFA indicator, when varying the sliding window length. (Online version in colour.)
Figure 5.
Figure 5.
Search for early warning of Atlantic thermohaline circulation collapse in the CLIMBER-2 model. (a) Principal component of salinity, as freshwater forcing is gradually increased and white noise is applied in order to diagnose ocean dynamics. Analysis stops at the vertical dashed line before the transition (n=783). (b) Example of early warning indicators from detrended fluctuation analysis (DFA) or autocorrelation function (ACF) with various detrending methods and results plotted at the end of the windows (sliding window length of half the data series in all cases, bandwidth=50 for ACF method). (c) Histogram of the frequency distribution of the Kendall trend statistic for the ACF of residuals indicator, when varying the sliding window length and filtering bandwidth. (d) Histogram of the frequency distribution of the Kendall trend statistic for the DFA indicator, when varying the sliding window length. (Online version in colour.)
Figure 6.
Figure 6.
Search for early warning of Atlantic thermohaline circulation collapse in the GENIE-1 model. (a) Strength of the Atlantic meridional overturning circulation (Sv) as freshwater forcing is gradually increased, and white noise is applied in order to diagnose ocean dynamics. Analysis stops at the vertical dashed line before the transition (n=37 600). (b) Example of early warning indicators from detrended fluctuation analysis (DFA) or autocorrelation function (ACF) with various detrending methods and results plotted at the end of the windows (sliding window length of half the data series in all cases, bandwidth=100 for ACF method). (c) Histogram of the frequency distribution of the Kendall trend statistic for the ACF of residuals indicator, when varying the sliding window length and filtering bandwidth. (d) Histogram of the frequency distribution of the Kendall trend statistic for the DFA indicator, when varying the sliding window length. (Online version in colour.)
Figure 7.
Figure 7.
Search for early warning of Atlantic thermohaline circulation collapse in the GENIE-2 model. (a) Strength of the Atlantic meridional overturning circulation (Sv) as freshwater forcing is gradually increased, with the dynamical atmosphere driving short-term variability in the ocean circulation. Analysis stops at the vertical dashed line before the transition (n=5270). (b) Example of early warning indicators from detrended fluctuation analysis (DFA) or autocorrelation function (ACF) with various detrending methods and results plotted at the end of the windows (sliding window length of half the data series in all cases, bandwidth=1000 for ACF method). (c) Histogram of the frequency distribution of the Kendall trend statistic for the ACF of residuals indicator, when varying the sliding window length and filtering bandwidth. (d) Histogram of the frequency distribution of the Kendall trend statistic for the DFA indicator, when varying the sliding window length. (Online version in colour.)
Figure 8.
Figure 8.
The effect of data aggregation on early warning of thermohaline circulation collapse in a coupled ocean–atmosphere model. Based on aggregating results from the GENIE-2 model (figure 7a). Contour plots show the value of the Kendall trend statistic for the ACF indicator derived after detrending by Gaussian filtering, when varying the sliding window length and filtering bandwidth. Analysis based on (a) raw data (as in figure 7c), (b) data averaged to Δt=5 years (n=1054), (c) Δt=10 years (n=527) or (d) Δt=20 years (n=263) resolution. Note the change in bandwidth range between (a) and (bd).
Figure 9.
Figure 9.
Trends in variance as a threshold is approached for all the datasets. Contour plots show the value of the Kendall trend statistic for the trend in standard deviation, derived after detrending by Gaussian filtering across the whole series, when varying the sliding window length and filtering bandwidth. For different datasets: (a) Vostok, (b) GISP2, (c) Cariaco, (d) CLIMBER-2, (e) GENIE-1, (f) GENIE-2 (raw data).

References

    1. Lenton T. M., Held H., Kriegler E., Hall J., Lucht W., Rahmstorf S., Schellnhuber H. J.2008Tipping elements in the Earth's climate system Proc. Natl Acad. Sci. USA 1051786–1793. 10.1073/pnas.0705414105 (doi:10.1073/pnas.0705414105) - DOI - PMC - PubMed
    1. Allison I., et al. The Copenhagen Diagnosis: updating the world on the latest climate science. Amsterdam, The Netherlands: Elsevier; 2011.
    1. Smith J. B., et al. 2009Assessing dangerous climate change through an update of the Intergovernmental Panel on Climate Change (IPCC) ‘reasons for concern’ Proc. Natl Acad. Sci. USA 1064133–4137. 10.1073/pnas.0812355106 (doi:10.1073/pnas.0812355106) - DOI - PMC - PubMed
    1. Scheffer M., et al. 2009Early warning signals for critical transitions Nature 46153–59. 10.1038/nature08227 (doi:10.1038/nature08227) - DOI - PubMed
    1. Wiesenfeld K., McNamara B.1986Small-signal amplification in bifurcating dynamical systems Phys. Rev. A 33629–642. 10.1103/PhysRevA.33.629 (doi:10.1103/PhysRevA.33.629) - DOI - PubMed