Meta-Analysis
. 2012 Jan;10(1):e1001247.
doi: 10.1371/journal.pbio.1001247. Epub 2012 Jan 24.

Structural and functional loss in restored wetland ecosystems

Affiliations
Meta-Analysis

Structural and functional loss in restored wetland ecosystems

David Moreno-Mateos et al. PLoS Biol. 2012 Jan.

Abstract

Wetlands are among the most productive and economically valuable ecosystems in the world. However, because of human activities, over half of the wetland ecosystems existing in North America, Europe, Australia, and China in the early 20th century have been lost. Ecological restoration to recover critical ecosystem services has been widely attempted, but the degree of actual recovery of ecosystem functioning and structure from these efforts remains uncertain. Our results from a meta-analysis of 621 wetland sites from throughout the world show that even a century after restoration efforts, biological structure (driven mostly by plant assemblages), and biogeochemical functioning (driven primarily by the storage of carbon in wetland soils), remained on average 26% and 23% lower, respectively, than in reference sites. Either recovery has been very slow, or postdisturbance systems have moved towards alternative states that differ from reference conditions. We also found significant effects of environmental settings on the rate and degree of recovery. Large wetland areas (>100 ha) and wetlands restored in warm (temperate and tropical) climates recovered more rapidly than smaller wetlands and wetlands restored in cold climates. Also, wetlands experiencing more (riverine and tidal) hydrologic exchange recovered more rapidly than depressional wetlands. Restoration performance is limited: current restoration practice fails to recover original levels of wetland ecosystem functions, even after many decades. If restoration as currently practiced is used to justify further degradation, global loss of wetland ecosystem function and structure will spread.


Conflict of interest statement

The authors have declared that no competing interests exist.

Figures
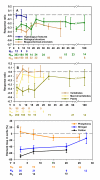
Figure 1
Figure 1. Recovery trajectories of created and restored wetlands.
Chronosequences of the means (±standard error [SE]) of the response ratios (see Materials and Methods) of restored and created wetlands at successive age classes of 5 y or 10 consecutive y for hydrology, biological structure, and biogeochemical functions (A) and for the main biological structural components (B). Chronosequences of the means (±SE) of the element loss in soils of restored or created wetlands at successive age classes of 5 y or 10 consecutive y (C). The zero value dashed line represents reference wetlands. Only trend lines for those variables for which we had enough data points (see Materials and Methods) were plotted (N, number of data points used to calculate the mean [±SE] per age class; Y, years after restoration. Subscripts are as follows: bp, biogeochemical processes; bs, biological structure; C, carbon; hf, hydrological features; m, macroinvertebrates; N, nitrogen; p, plants; P, phosphorus; v, vertebrates).
Figure 2
Figure 2. Recovery trajectories of animal and plant richness and density.
Chronosequences of the means (±standard error [SE]) of the response ratios (see Materials and Methods) of restored or created wetlands at successive age classes of 5 y or 10 consecutive y for vertebrates and macroinvertebrates density and richness (A) and for plant density and richness (B). Insufficient data points meeting our plotting criteria (see Materials and Methods) were available to plot for macroinvertebrate richness. The zero value dashed line represents reference wetlands (N, number of data points used to calculate the mean [±SE] per age class; Y, years after restoration. Subscripts are as follows: md, macroinvertebrates density; pd, plant density; pr, plant richness; vd, vertebrate density; vr, vertebrates richness).
Figure 3
Figure 3. Effect of size on wetland recovery.
Evolution of the mean (±standard error [SE]) of the response ratios (see Materials and Methods) of restored or created wetlands at successive size categories for wetlands between 0 y to 5 y after restoration or creation. The zero value dashed line represents reference wetlands. Mean (±SE) at 0.1 ha was estimated for wetlands with sizes ≤0.1 ha. Means (±SE) at 1 ha were estimated for wetlands in which sizes ranged between 0.1 ha and 1 ha. The same approach was used to estimate the means (±SE) at 10, 100, 1,000, and 10,000 ha (N, number of data points used to calculate the mean [±SE] per age class; size, size in hectares of the restored wetlands. Subscripts are as follows: bp, biogeochemical processes; bs, biological structure).
Figure 4
Figure 4. Effects of climate and hydrology on wetland recovery trajectories.
Chronosequences of the means (±standard error [SE]) of the response ratios (see Materials and Methods) of restored and created wetlands at successive age classes of 5 y or 10 consecutive y for biogeochemical functions and for biological structures under contrasting climates (A and B), and under different hydrologic connectivity (C and D) . The zero value dashed line represents reference wetlands. The arrow (B) indicates the outlier mean value of two restoration studies with extremely low recovery rates (N, number of data points used to calculate the mean [±SE] per age class; Y, years after restoration. Subscripts are as follows: bp, boreal peatland; d, depressional; hc, humid cold; ht, humid temperate; r, riverine; str, seasonal tropical; ste, seasonal temperate; t, tidal).

References

    1. Costanza R, dArge R, deGroot R, Farber S, Grasso M, et al. The value of the world's ecosystem services and natural capital. Nature. 1997;387:253–260.
    1. Mitsch W. J, Gosselink J. G. Wetlands. Hoboken (New Jersey): John Wiley & Sons, Inc; 2007. pp. 177–183.
    1. Millenium Ecosystem Assessment. Ecosystems and human well-being: wetlands and water. Washington (D.C.): World Resources Institute; 2005.
    1. Palmer M. A. Reforming watershed restoration: science in need of application and applications in need of science. Estuaries Coasts. 2009;32:1–17.
    1. Matthews J. W, Endress A. G. Performance criteria, compliance success, and vegetation development in compensatory mitigation wetlands. Environ Manage. 2008;41:130–141. - PubMed

Publication types