. 2012 Jan;8(1):e1002448.
doi: 10.1371/journal.pgen.1002448. Epub 2012 Jan 26.

Two-component elements mediate interactions between cytokinin and salicylic acid in plant immunity

Affiliations

Two-component elements mediate interactions between cytokinin and salicylic acid in plant immunity

Cristiana T Argueso et al. PLoS Genet. 2012 Jan.

Abstract

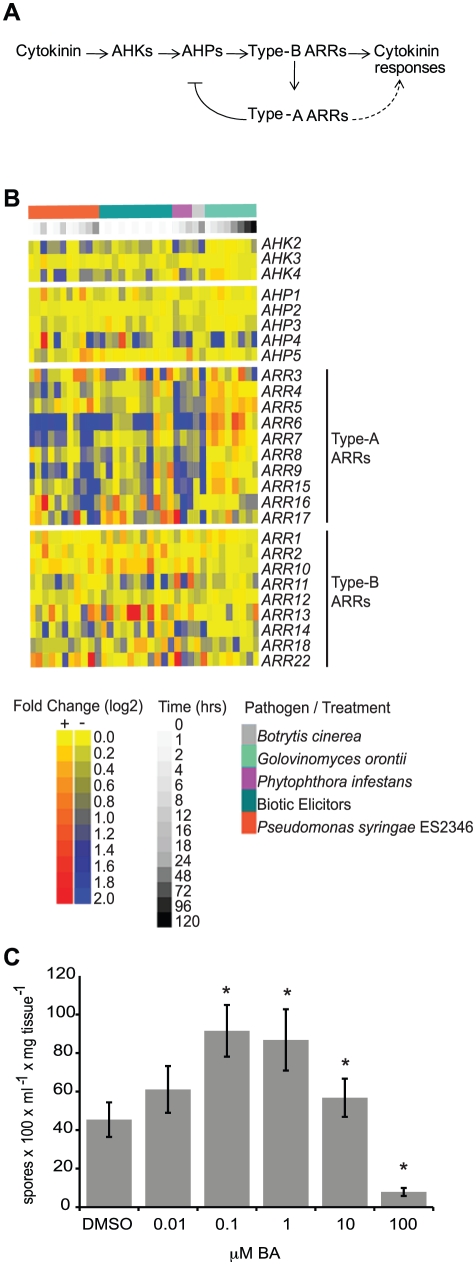
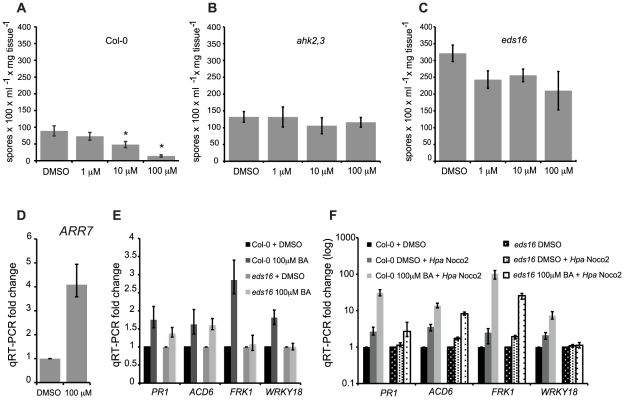
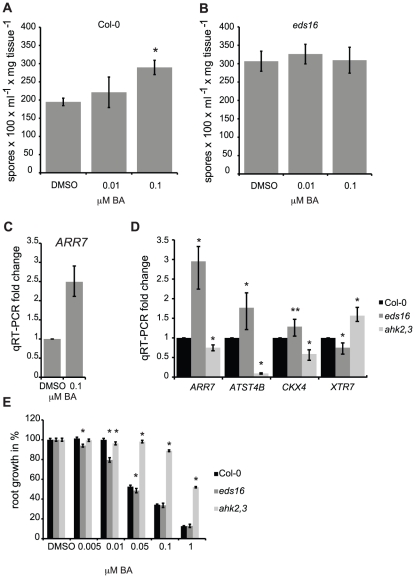
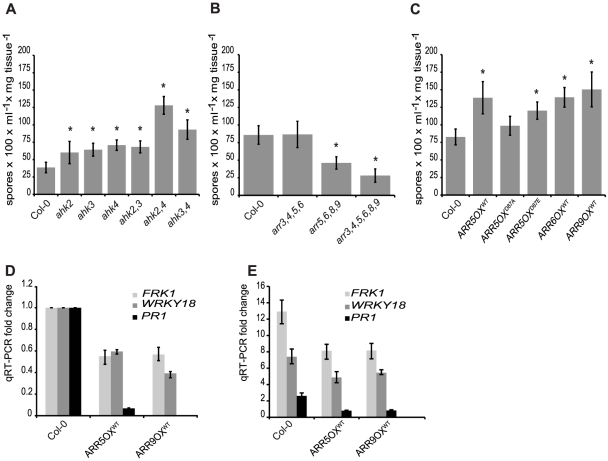
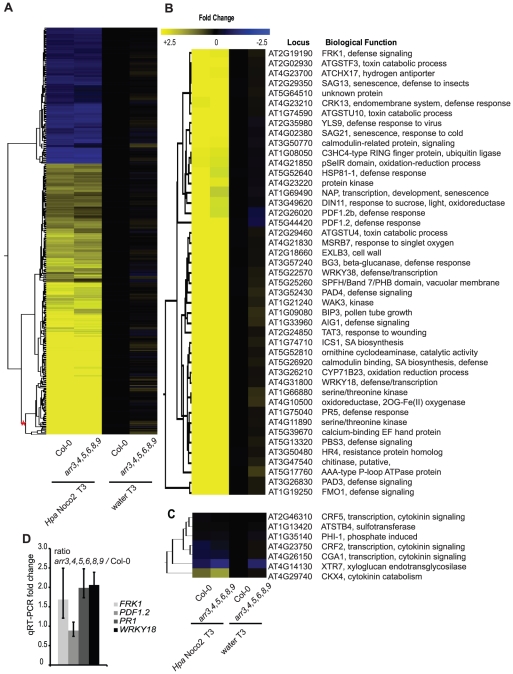
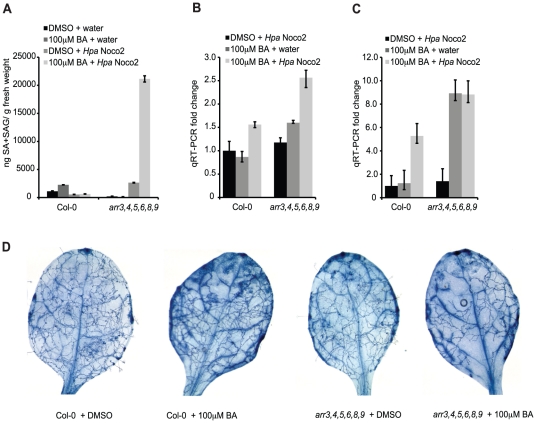
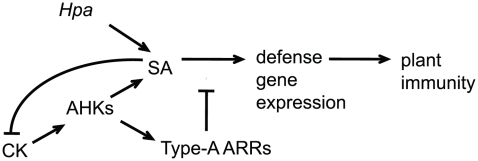
Recent studies have revealed an important role for hormones in plant immunity. We are now beginning to understand the contribution of crosstalk among different hormone signaling networks to the outcome of plant-pathogen interactions. Cytokinins are plant hormones that regulate development and responses to the environment. Cytokinin signaling involves a phosphorelay circuitry similar to two-component systems used by bacteria and fungi to perceive and react to various environmental stimuli. In this study, we asked whether cytokinin and components of cytokinin signaling contribute to plant immunity. We demonstrate that cytokinin levels in Arabidopsis are important in determining the amplitude of immune responses, ultimately influencing the outcome of plant-pathogen interactions. We show that high concentrations of cytokinin lead to increased defense responses to a virulent oomycete pathogen, through a process that is dependent on salicylic acid (SA) accumulation and activation of defense gene expression. Surprisingly, treatment with lower concentrations of cytokinin results in increased susceptibility. These functions for cytokinin in plant immunity require a host phosphorelay system and are mediated in part by type-A response regulators, which act as negative regulators of basal and pathogen-induced SA-dependent gene expression. Our results support a model in which cytokinin up-regulates plant immunity via an elevation of SA-dependent defense responses and in which SA in turn feedback-inhibits cytokinin signaling. The crosstalk between cytokinin and SA signaling networks may help plants fine-tune defense responses against pathogens.


Conflict of interest statement

The authors have declared that no competing interests exist.

Figures

Figure 1
Figure 1. Cytokinin and two-component elements play a role in plant immunity.
(A) Model of the cytokinin signaling pathway in Arabidopsis. Arrows indicate positive interactions, bar indicates a negative interaction. (B) Heat map of gene expression of two-component elements in Arabidopsis following pathogen or elicitor treatment. Microarray data was obtained from AtGenExpress (http://www.uni-tuebingen.de/plantphys/AFGN/atgenex.htm) and analyzed using the e-northern tool of the Bio-Array Resource for Arabidopsis Functional Genomics (http://bar.utoronto.ca/). (C) Susceptibility of cytokinin-treated Arabidopsis to Hpa Noco2. Two-week-old wild-type plants were sprayed with the indicated concentrations of BA or DMSO control 48 hours prior to inoculation with Hpa Noco2. Spore production was measured as described in Methods. Error bars represent SE (n = 6). Asterisks indicate statistically significant differences from wild-type plants (p-value<0.05, two-tailed student's t-test). The experiment was repeated at least three times independently. Data from one representative experiment are shown.
Figure 2
Figure 2. High concentrations of cytokinin prime defense responses via SA accumulation.
Susceptibility of cytokinin-treated wild-type (A), ahk2,3 (B) or eds16 (C) plants to Hpa Noco2. Two-week-old plants were sprayed with the indicated concentrations of BA or DMSO control 48 hours prior to inoculation with Hpa Noco2. Spore production was measured as described in Methods. Error bars represent SE (n≥4). Asterisks indicate statistically significant differences from wild-type plants (p-value<0.05, two-tailed student's t-test). The experiment was conducted in parallel for all genotypes above and repeated at least three times independently. Data from one representative experiment are shown. (D) ARR7 expression in response to cytokinin treatment. RNA was extracted from two-week-old wild-type plants from (A) that had been sprayed with the indicated concentration of BA or DMSO control, 48 hours after treatment. Levels of ARR7 were determined by qRT-PCR relative to DMSO samples. Error bars represent SE from three technical replicates and correspond to upper and lower limits of 95% confidence intervals. At least three independent biological replicates of the experiment were conducted with similar results. Data from one representative independent biological replicate are shown. (E) Expression of defense genes after cytokinin treatment. Two-week-old wild-type and eds16 plants were treated with the indicated concentration of BA or DMSO. RNA was extracted from tissue 48 hours after treatment. Transcripts levels were determined by qRT-PCR relative to samples treated with DMSO. Error bars represent SE from three technical replicates and correspond to upper and lower limits of 95% confidence intervals. At least three independent biological replicates of the experiment were conducted with similar results. Data from one representative independent biological replicate are shown. (F) Defense gene expression is enhanced by pre-treatment with cytokinin. Two-week-old wild-type and eds16 plants were pre-treated with the indicated concentration of BA or DMSO control 48 hours prior to inoculation with water or Hpa Noco2. RNA was extracted from tissue harvested at 3 dpi. Transcripts levels were determined by qRT-PCR relative to the respective DMSO-treated genotypes. Error bars represent SE from three technical replicates and correspond to upper and lower limits of 95% confidence intervals. At least three independent biological replicates of the experiment were conducted with similar results. Data from one representative independent biological replicate are shown.
Figure 3
Figure 3. SA negatively regulates cytokinin signaling.
Susceptibility of cytokinin-treated wild-type (A) and eds16 (B) plants to Hpa Noco2. Two-week-old plants were sprayed with the indicated concentrations of BA or DMSO control 48 hours prior to inoculation with Hpa Noco2. Spore production was measured as described in Methods. Error bars represent SE (n≥4). Asterisks indicate statistically significant differences from wild-type plants (p-value<0.05, two-tailed student's t-test). The experiment was conducted in parallel for all genotypes above and repeated at least three times independently. Data from one representative experiment are shown. (C) ARR7 expression in response to cytokinin treatment. RNA was extracted from two-week-old wild-type plants from (A) that had been sprayed with the indicated concentration of BA or DMSO control, 48 hours after treatment. Levels of ARR7 were determined by qRT-PCR relative to DMSO samples. Error bars represent SE from three technical replicates and correspond to upper and lower limits of 95% confidence intervals. At least three independent biological replicates of the experiment were conducted with similar results. Data from one representative independent biological replicate are shown. (D) Basal expression of cytokinin-regulated genes in wild-type, eds16 and ahk2,3 plants. RNA was extracted from tissue harvested from untreated two-week-old seedlings. Levels of transcripts were determined by qRT-PCR relative to wild-type samples. Error bars represent SE from three technical replicates and correspond to upper and lower limits of 95% confidence intervals. At least three independent biological replicates of the experiment were conducted with similar results. Data from one representative independent biological replicate are shown. Statistically significant differences from wild-type plants (one-tailed student's t-test) are represented by asterisks (* = p-value<0.05, ** = p-value<0.075). (E) Primary root elongation assay for cytokinin sensitivity. Wild-type, eds16 or ahk2,3 seedlings were grown vertically on plates supplemented with the specified concentrations of BA or DMSO control under constant light conditions at 23°C. Primary root elongation between days 4 and 9 was measured as described in Methods. Results shown were pooled from an experimental set of three independent samples of 10 to 15 individual seedlings each. Asterisks indicate statistically significant differences from the wild type at the given concentrations of BA (two-tailed student's t-test, P<0.05). Error bars represent SE (n≥22). This experiment was repeated twice with consistent results.
Figure 4
Figure 4. A two-component phosphorelay, negatively regulated by type-A ARRs, is required for defense responses.
(A) Susceptibility of ahk receptor single and double mutants to Hpa Noco2. Two-week-old plants were inoculated with Hpa Noco2 and spore production measured as described in Methods. Error bars represent SE (n≥4). Asterisks indicate statistically significant differences from wild-type plants (p-value<0.05, two-tailed student's t-test). The experiment was repeated at least three times independently. Data from one representative experiment are shown. (B) Susceptibility of type-A arr multiple mutants to Hpa Noco2. Two-week-old plants were inoculated with Hpa Noco2 and spore production measured as described in Methods. Error bars represent SE (n≥4). Asterisks indicate statistically significant differences from wild-type plants (p-value<0.05, two-tailed student's t-test). The experiment was repeated at least three times independently. Data from one representative experiment are shown. (C) Susceptibility of transgenic lines overexpressing type-A ARRs to Hpa Noco2. Two-week-old wild-type plants or transgenic lines overexpressing wild-type (ARR5, ARR6, ARR9), phospho-mimic (ARR5D87E) and phospho-deficient (ARR5D87A) forms of type-A ARRs were inoculated with Hpa Noco2 and spore production measured as described in Methods. Error bars represent SE (n≥4). Asterisks indicate statistically significant differences from wild-type plants (p-value<0.05, two-tailed student's t-test). The experiment was repeated at least three times independently. Data from one representative experiment are shown. (D) Basal defense gene expression in transgenic lines overexpressing type-A ARRs. Two-week-old wild-type plants or transgenic lines overexpressing wild-type type-A ARRs (ARR5 and ARR9) were inoculated with water. RNA was extracted from tissue harvested three days later. Levels of the indicated transcripts were determined by qRT-PCR relative to wild-type plants. Error bars represent SE from three technical replicates and correspond to upper and lower limits of 95% confidence intervals. At least three independent biological replicates of the experiment were conducted with similar results. Data from one representative independent biological replicate are shown. (E) Defense gene expression in response to Hpa Noco2 in transgenic lines overexpressing type-A ARRs. Two-week-old wild-type plants or transgenic lines overexpressing wild-type type-A ARRs (ARR5 and ARR9) were inoculated with water or Hpa Noco2. RNA was extracted from tissue harvested at 3 dpi. Levels of the indicated transcripts were determined by qRT-PCR relative to water-treated samples. Error bars represent SE from three technical replicates and correspond to upper and lower limits of 95% confidence intervals. At least three independent biological replicates of the experiment were conducted with similar results. Data from one representative independent biological replicate are shown.
Figure 5
Figure 5. Type-A ARRs negatively regulate SA–dependent gene expression.
(A) Transcriptome analysis of type-A arr3,4,5,6,8,9 mutant plants in response to Hpa Noco2. Two-week-old wild-type or type-A arr3,4,5,6,8,9 mutant plants were inoculated with either water or Hpa Noco2. Tissue was harvested at 3 dpi. For the analysis, wild-type water-treated samples were used as a baseline. Genes up- or down-regulated at least two-fold by Hpa Noco2 in wild-type plants were selected. Hierarchical clustering (K-means) of Hpa Noco2-regulated genes in wild-type plants is shown. See also Table S1. (B) Subset of Hpa Noco2-regulated genes with altered expression in the arr3,4,5,6,8,9 mutants. Hpa Noco2-regulated genes from the most highly regulated cluster from (A) (red asterisk) that are differentially regulated in unchallenged arr3,4,5,6,8,9 mutant plants. (C) Representative cytokinin-regulated genes that are also Hpa Noco2-regulated. (D) qRT-PCR of select genes from (A). Two-week-old wild-type or arr3,4,5,6,8,9 plants were inoculated with water. RNA was extracted from tissue harvested three days later. Levels of the indicated transcripts were determined by qRT-PCR relative to wild-type plants. Error bars represent SE from three technical replicates and correspond to upper and lower limits of 95% confidence intervals. Data from one biological replicate are shown.
Figure 6
Figure 6. Type-A ARRs act in plant immunity downstream of SA.
(A) Total SA production in response to Hpa Noco2 after cytokinin treatment. Two-week-old wild-type and arr3,4,5,6,8,9 plants were pre-treated with the indicated concentration of BA or DMSO control 48 hours prior to inoculation with water or Hpa Noco2. Tissue was harvested at 3 dpi and total SA (SA+SAG) measured as described in Methods. Error bars represent SE (n≥4). The experiment was repeated at least three times independently. Data from one representative experiment are shown. (B) ICS1 expression in response to Hpa Noco2 after cytokinin treatment. Two-week-old wild-type and arr3,4,5,6,8,9 plants were treated as in (A). Tissue was harvested at 3 dpi. Levels of ICS1 were determined by qRT-PCR relative to water-treated samples pre-treated with DMSO. For simplicity, the relative change of all samples was normalized to the wild-type DMSO+Hpa Noco2 levels. Error bars represent SE from three technical replicates and correspond to upper and lower limits of 95% confidence intervals. The experiment was repeated at least three times independently. Data from one representative experiment are shown. (C) PR1 expression in response to Hpa Noco2 after cytokinin treatment. Two-week-old wild-type and arr3,4,5,6,8,9 plants were treated as in (A). Tissue was harvested at 3 dpi. Levels of PR1 were determined by qRT-PCR relative to water-treated samples pre-treated with DMSO. For simplicity, the relative change for all samples was normalized to the wild-type DMSO+Hpa Noco2 levels. Error bars represent SE from three technical replicates and correspond to upper and lower limits of 95% confidence intervals. The experiment was repeated at least three times independently. Data from one representative experiment are shown. (D) Trypan blue staining after Hpa Noco2 inoculation. Two-week-old wild-type and arr3,4,5,6,8,9 plants were treated as in (A). Plants were harvested at 4 dpi and stained with lacto-phenol trypan blue to visualize pathogen structures.
Figure 7
Figure 7. Model for cytokinin and type-A ARRs action in plant immunity.
Hpa Noco2 is perceived by Arabidopsis plants, leading to activation of salicylic acid (SA)-dependent responses and defense gene expression. High concentrations of cytokinin (CK) potentiate SA-dependent defense gene expression leading to decreased susceptibility, in a process that is counteracted by the type-A Arabidopsis response regulators (ARRs) downstream of SA accumulation. In turn, SA inhibits cytokinin signaling, in a negative feedback mechanism that fine-tunes the process.

References

    1. Jones JDG, Dangl JL. The plant immune system. Nature. 2006;444:323–329. - PubMed
    1. Feys BJ, Parker JE. Interplay of signaling pathways in plant disease resistance. Trends in Genetics. 2000;16:449–455. - PubMed
    1. Spoel SH, Dong XN. Making sense of hormone crosstalk during plant immune responses. Cell Host & Microbe. 2008;3:348–351. - PubMed
    1. Robert-Seilaniantz A, Navarro L, Bari R, Jones JD. Pathological hormone imbalances. Current Opinion in Plant Biology. 2007;10:372–379. - PubMed
    1. Argueso CT, Ferreira FJ, Kieber JJ. Environmental perception avenues: the interaction of cytokinin and environmental response pathways. Plant Cell and Environment. 2009;32:1147–1160. - PubMed

Publication types

MeSH terms