. 2012 Jan 6:5:102.
doi: 10.3389/fnsys.2011.00102. eCollection 2011.

Using large-scale neural models to interpret connectivity measures of cortico-cortical dynamics at millisecond temporal resolution

Affiliations

Using large-scale neural models to interpret connectivity measures of cortico-cortical dynamics at millisecond temporal resolution

Arpan Banerjee et al. Front Syst Neurosci. .

Abstract

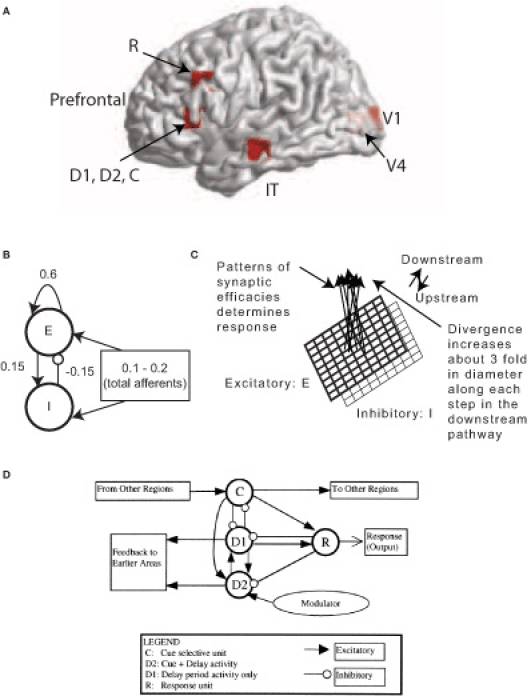
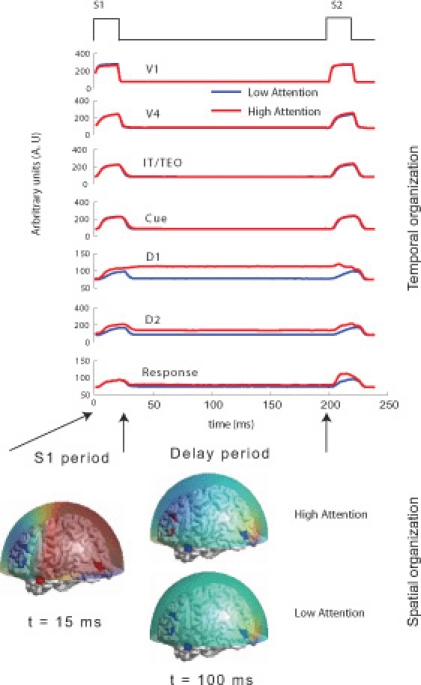
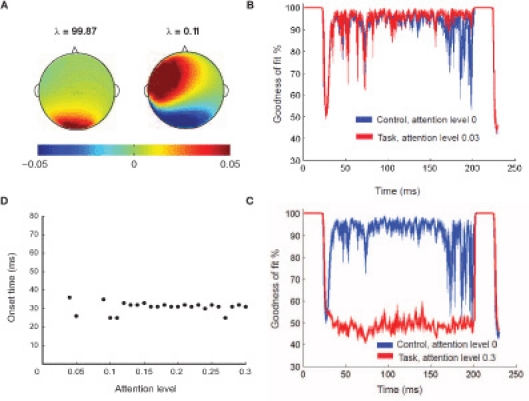
Over the last two decades numerous functional imaging studies have shown that higher order cognitive functions are crucially dependent on the formation of distributed, large-scale neuronal assemblies (neurocognitive networks), often for very short durations. This has fueled the development of a vast number of functional connectivity measures that attempt to capture the spatiotemporal evolution of neurocognitive networks. Unfortunately, interpreting the neural basis of goal directed behavior using connectivity measures on neuroimaging data are highly dependent on the assumptions underlying the development of the measure, the nature of the task, and the modality of the neuroimaging technique that was used. This paper has two main purposes. The first is to provide an overview of some of the different measures of functional/effective connectivity that deal with high temporal resolution neuroimaging data. We will include some results that come from a recent approach that we have developed to identify the formation and extinction of task-specific, large-scale neuronal assemblies from electrophysiological recordings at a ms-by-ms temporal resolution. The second purpose of this paper is to indicate how to partially validate the interpretations drawn from this (or any other) connectivity technique by using simulated data from large-scale, neurobiologically realistic models. Specifically, we applied our recently developed method to realistic simulations of MEG data during a delayed match-to-sample (DMS) task condition and a passive viewing of stimuli condition using a large-scale neural model of the ventral visual processing pathway. Simulated MEG data using simple head models were generated from sources placed in V1, V4, IT, and prefrontal cortex (PFC) for the passive viewing condition. The results show how closely the conclusions obtained from the functional connectivity method match with what actually occurred at the neuronal network level.

Keywords: EEG; MEG; decoding; delayed match-to-sample (DMS); high resolution; information processing; large-scale networks; timing.


Figures

Figure 1
Figure 1
MEG Extension of the Tagamets-Horwitz (1998) large-scale neural model. (A) Locations in the ventral visual stream where sources are located for simulating MEG data. The 3-D Talairach coordinates have been projected to the nearest gray matter on the cortical surface within a window of 5 mm. The medial surface locations V1 and V4 are shaded in lighter color, pink whereas the lateral surface locations in inferior temporal (IT) and prefrontal cortex (PFC) in brighter red. (B) The basic Wilson-Cowan unit. E represents the excitatory population and / the inhibitory population in a local assembly such as a cortical column. Local synaptic activity is dominated by the local excitation and inhibition, while afferents account for the smallest proportion, as indicated by the synaptic weights shown. (C) A cortical area is modeled by a 9 × 9 set of basic units. The excitatory population is shown in bold lines above the inhibitory group, shown in lighter lines. Individual units in the excitatory and inhibitory populations within a group are connected as shown in (B). (D) The working memory circuit in the prefrontal area of the model. It is composed of different types of units, as identified in electrophysiological studies, and shown in (C). Each element of the circuit shown is a basic unit, as shown in (B). Inhibitory connections are affected by excitatory connections onto inhibitory units. These D2 units also are the source of feedback into earlier areas. Figures B–D are adapted with permission from (Tagamets and Horwitz, 1998).
Figure 2
Figure 2
Temporal and spatial organization of simulated neural activity: Total currents in each brain location computed using the large-scale neural model for two different levels of attention (0 and 0.3). During stimulus S1, the sensory and object identification areas are first activated (V1, V4 and IT) followed by activations in prefrontal network (D1, D2, C, and R). For low attention (or zero attention) all units are silent during delay period because no working memory is required to perform the DMS task. D1 and D2 units have sustained activation (recruited) during delay period if high attention is required to store the identity of S1 in working memory while the other units were silent. Neuromagnetic (MEG) activity is simulated at 264 sensors using a forward solution with spherical head model. Topographic maps of this activity are plotted over a transparent hemisphere at times t = 15 (within initial S1) and t = 100 (during delay). During S1 similar identical network organization between passive viewing (low attention) and DMS task performance (high attention) occurs. However, network organization changes during the delay period. Discerning by looking at raw topographic maps is quite hard, as illustrated by closeness of the scalp topography between the two task conditions during delay period. The temporal microstructure of cortical network (TMCN) analysis retrieves the onset of recruitment of the task-specific prefrontal networks at the sensor level.
Figure 3
Figure 3
Temporal microstructure analysis. (A) The two principal components (and corresponding eigenvalues λ) computed from the DMS task at lowest attention level that spans the control subspace. The sum of the eigenvalues amounts to the total variance of the control condition that is capture by these two patterns. (B) The mean goodness of fit of reconstruction (Gof) time series plotted as a function of time when the difference in attention levels is low. The error bars at 95% significance level are also plotted as a function of time (patches). In this scenario, lack of significant recruitment results in statistically equivalent Gof over time. (C) The mean goodness Gof time series from two conditions are plotted as a function of time when the difference in attention levels is high. The error bars at 95% significance level are also plotted as a function of time (patches). The regime of difference in Gof distributions reflect the time scale of recruitment. (D) Sensitivity analysis for onset time detection: Onset time plotted as function of different attention levels. For all levels of attention (except the zero attention scenario) the same prefrontal network (D1, D2) is recruited in the delay period, with varying degrees of intensity. At low attention (gain < 0.09), onset time of this prefrontal network recruitment occurs twice by chance. However, after a threshold level of attention (0.09), onset time is consistently detected for all higher levels.

References

    1. Amari S. (1977). Dynamics of pattern formation in lateral-inhibition type neural fields. Biol. Cybern. 27, 77–87 - PubMed
    1. Antonini M., Barlaud M., Mathieu P., Daubechies I. (1992). Image coding using wavelet transform. IEEE Trans. Image Process 1, 205–220 10.1109/83.136597 - DOI - PubMed
    1. Arnhold J., Grassberger P., Lehnertz K., Elger C. E. (1999). A robust method for detecting interdependences: application to intracranially recorded EEG. Physica. D 134, 419–430
    1. Assisi C. G., Jirsa V. K., Kelso J. A. (2005). Synchrony and clustering in heterogeneous networks with global coupling and parameter dispersion. Phys. Rev. Lett. 94, 018106 10.1103/PhysRevLett.94.018106 - DOI - PubMed
    1. Atkinson R. C., Shiffrin R. M. (1968). Human Memory: A Proposed System and Its Control Processes. New York: Academic Press