. 2012 Jan 10:2:280.
doi: 10.3389/fmicb.2011.00280. eCollection 2011.

Fluorescent Reporter Signals, EGFP, and DsRed, Encoded in HIV-1 Facilitate the Detection of Productively Infected Cells and Cell-Associated Viral Replication Levels

Affiliations

Fluorescent Reporter Signals, EGFP, and DsRed, Encoded in HIV-1 Facilitate the Detection of Productively Infected Cells and Cell-Associated Viral Replication Levels

Kazutaka Terahara et al. Front Microbiol. .

Abstract

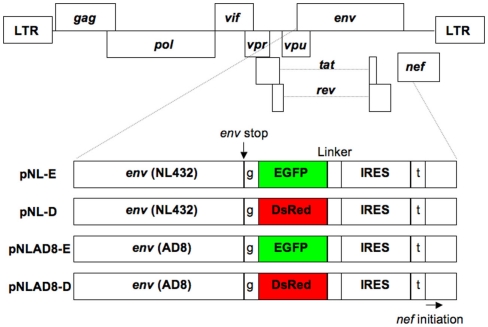
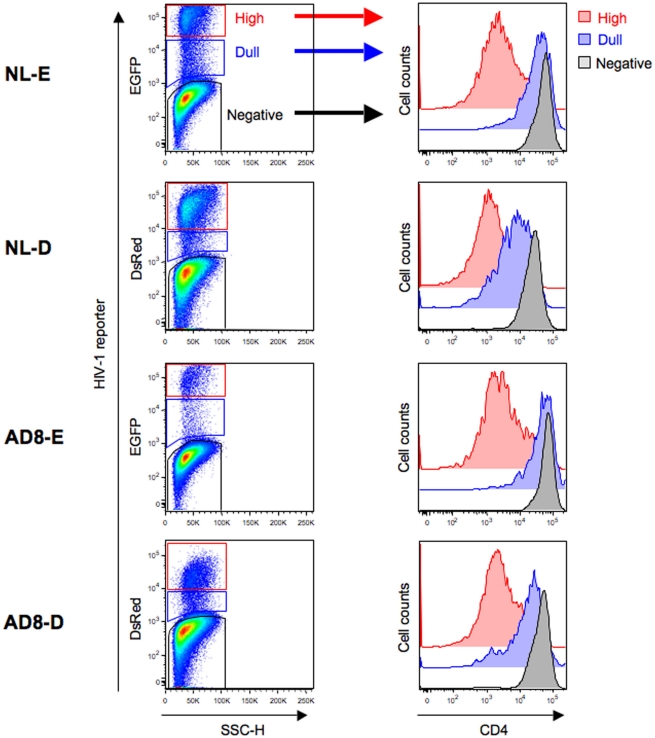
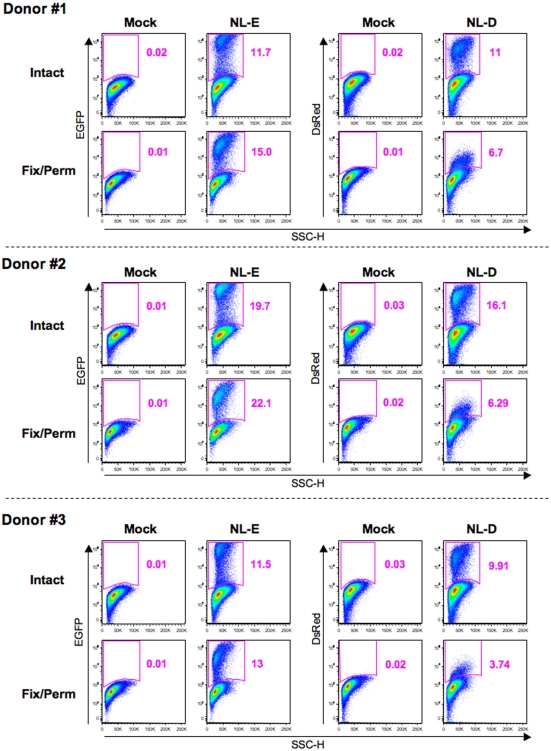
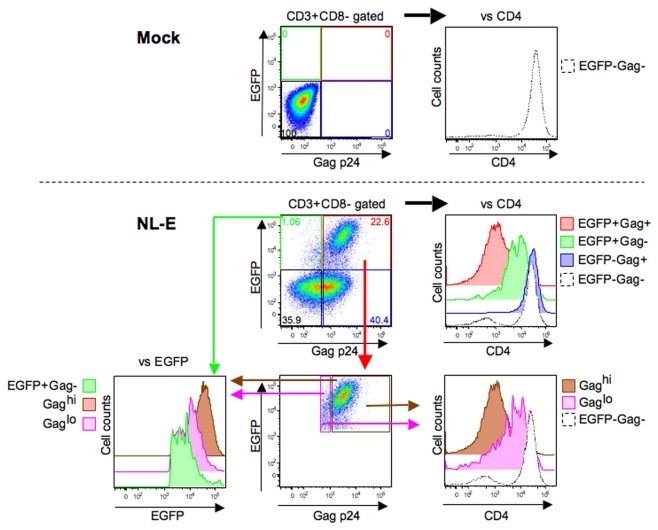
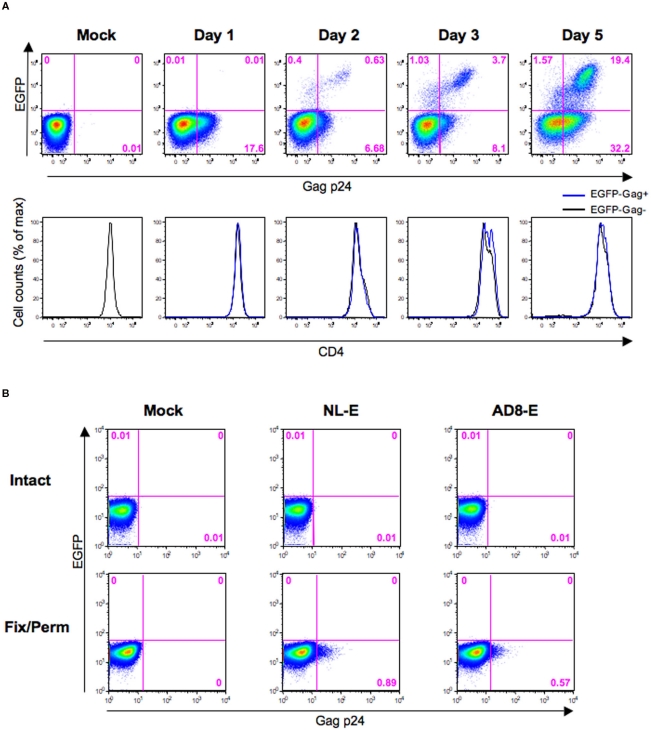
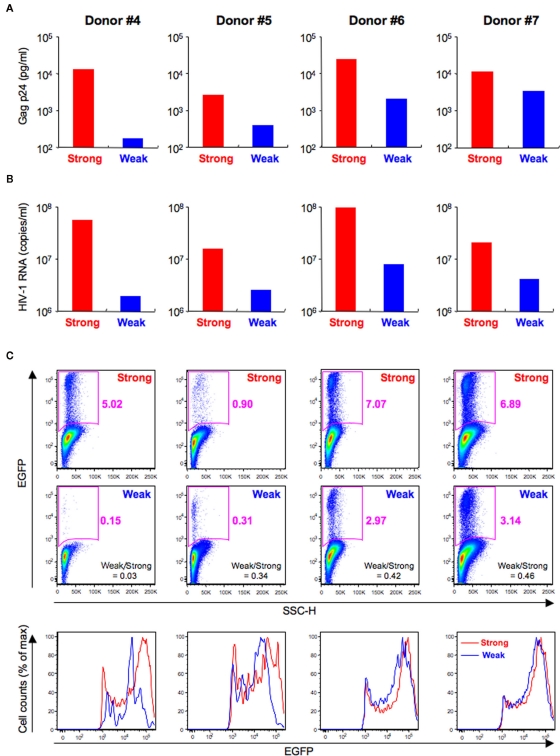
Flow cytometric analysis is a reliable and convenient method for investigating molecules at the single cell level. Previously, recombinant human immunodeficiency virus type 1 (HIV-1) strains were constructed that express a fluorescent reporter, either enhanced green fluorescent protein, or DsRed, which allow the monitoring of HIV-1-infected cells by flow cytometry. The present study further investigated the potential of these recombinant viruses in terms of whether the HIV-1 fluorescent reporters would be helpful in evaluating viral replication based on fluorescence intensity. When primary CD4(+) T cells were infected with recombinant viruses, the fluorescent reporter intensity measured by flow cytometry was associated with the level of CD4 downmodulation and Gag p24 expression in infected cells. Interestingly, some HIV-1-infected cells, in which CD4 was only moderately downmodulated, were reporter-positive but Gag p24-negative. Furthermore, when the activation status of primary CD4(+) T cells was modulated by T cell receptor-mediated stimulation, we confirmed the preferential viral production upon strong stimulation and showed that the intensity of the fluorescent reporter within a proportion of HIV-1-infected cells was correlated with the viral replication level. These findings indicate that a fluorescent reporter encoded within HIV-1 is useful for the sensitive detection of productively infected cells at different stages of infection and for evaluating cell-associated viral replication at the single cell level.

Keywords: DsRed; EGFP; Gag; HIV-1; flow cytometry; productive infection.


Figures

Figure 1
Figure 1
Structure of the proviral DNA. The pNL432-based proviral clones encoded EGFP (pNL-E) or DsRed (pNL-D) for X4-tropic HIV-1NL-E or HIV-1NL-D, respectively, and the pNLAD8-based proviral clones encoded EGFP (pNLAD8-E) or DsRed (pNLAD8-D) for R5-tropic HIV-1NLAD8-E or HIV-1NLAD8-D, respectively. EGFP or DsRed was not expressed as a fusion protein with Env due to the insertion of a single base after the Env stop codon. Nef was also independently expressed under the control of IRES. t (Thymine) and g (guanine) are additional DNA sequences.
Figure 2
Figure 2
Flow cytometry analysis of HIV-1-infected cells. Unstimulated CD4+ T cells were infected with HIV-1NL-E, HIV-1NL-D, HIV-1NLAD8-E, or HIV-1NLAD8-D and cultured for 5 days (including the initial 1 day culture with TCR-stimulation). (Left panels) representative pseudo-color plot profiles for the Dead/CD3+/CD8-gated cell fractions from three donors. Cells were classified as high (red), dull (blue), and negative (black) based on the HIV-1 reporter intensity. (Right panels) histograms of CD4 expression by the high (red), dull (blue), and negative (black) fractions defined.
Figure 3
Figure 3
Influence of fixation/permeabilization treatment on HIV-1 fluorescent reporter signals. Pseudo-color plot profiles for the Dead/CD3+/CD8-gated cell fractions from the mock, HIV-1NL-E infection (NL-E), and HIV-1NL-D infection (NL-D) groups from all three donors tested. Analyzed cells were prepared as outlined in the legend to Figure 2 and then either fixed/permeabilized (fix/perm) or not (intact).
Figure 4
Figure 4
Correlation between HIV-1 fluorescent reporter signal and Gag p24 expression. Representative flow cytometric analyses of the mock and HIV-1NL-E infection groups from six donors. These infection groups were prepared as outlined in the legend to Figure 2. The EGFP+Gag+ (red), EGFP+Gag (green), EGFPGag+ (blue), EGFPGag (black), Gaghi (brown), and Gaglo (pink) cell fractions were categorized based on the expression patterns of EGFP and Gag p24. The expression levels of CD4 and EGFP in each cell fraction were compared according to their histogram profiles.
Figure 5
Figure 5
Evaluation of Gag p24 ICS for HIV-1-internalized and -bound cells. (A) Representative flow cytometric analyses of the HIV-1NL-E infection (NL-E) and mock (Mock) groups from three donors in which unstimulated primary CD4+ T cells were infected with HIV-1NL-E or not, respectively, and cultured for 5 days (including the initial 1 day culture with TCR-stimulation). The expression patterns of EGFP and Gag p24 are indicated in the pseudo-color plot profiles for the Dead/CD3+/CD8-gated cell fractions (upper panels). The expression level of CD4 in EGFPGag+ and EGFPGag cells is indicated in the histograms by the blue and black lines, respectively (lower panels). (B) Representative flow cytometric analyses of Gag p24 staining. CEM–CCR5 cells were infected with HIV-1NL-E (NL-E), HIV-1AD8-E (AD8-E), or not (Mock). Immediately after spinoculation at 4°C, the cells were washed and fixed/permeabilized (fix/perm) or not (intact) prior to Gag p24 staining.
Figure 6
Figure 6
Differences of HIV-1 replication according to TCR-mediated activation levels. Primary CD4+ T cells from four donors (Donor #4–7) were pre-stimulated via TCR for 4 (Weak; blue) or 24 h (Strong; red) and then infected with HIV-1NL-E and cultured for 3 days. (A) ELISA for HIV-1 Gag p24 in the culture supernatants. (B) Quantitative real-time RT-PCR for HIV-1 RNA in the culture supernatants. (C) Flow cytometric analysis of intact cells showing pseudo-color plot profiles (Dead/CD3+/CD8-gated cell fraction; upper and middle panels) and histogram profiles (Dead/CD3+/CD8/EGFP+-gated cell fraction; lower panels).

References

    1. Berger E. A., Murphy P. M., Farber J. M. (1999). Chemokine receptors as HIV-1 coreceptors: roles in viral entry, tropism, and disease. Annu. Rev. Immunol. 17, 657–700 10.1146/annurev.immunol.17.1.657 - DOI - PubMed
    1. Bevis B. J., Glick B. S. (2002). Rapidly maturing variants of the Discosoma red fluorescent protein (DsRed). Nat. Biotechnol. 20, 83–87 10.1038/nbt0102-83 - DOI - PubMed
    1. Bosque A., Planelles V. (2009). Induction of HIV-1 latency and reactivation in primary memory CD4+ T cells. Blood 113, 58–65 10.1182/blood-2008-07-168393 - DOI - PMC - PubMed
    1. Bresters D., Schipper M. E., Reesink H. W., Boeser-Nunnink B. D., Cuypers H. T. (1994). The duration of fixation influences the yield of HCV cDNA-PCR products from formalin-fixed, paraffin-embedded liver tissue. J. Virol. Methods 48, 267–272 10.1016/0166-0934(94)90125-2 - DOI - PubMed
    1. Chalfie M. (1995). Green fluorescent protein. Photochem. Photobiol. 62, 651–656 10.1111/j.1751-1097.1995.tb08712.x - DOI - PubMed