. 2012;7(1):e30102.
doi: 10.1371/journal.pone.0030102. Epub 2012 Jan 23.

Structure-function studies of DNA binding domain of response regulator KdpE reveals equal affinity interactions at DNA half-sites

Affiliations

Structure-function studies of DNA binding domain of response regulator KdpE reveals equal affinity interactions at DNA half-sites

Anoop Narayanan et al. PLoS One. 2012.

Abstract

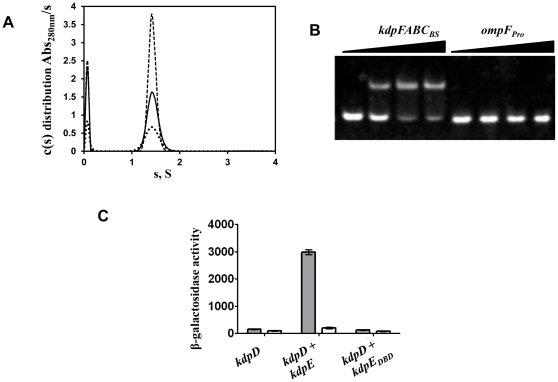
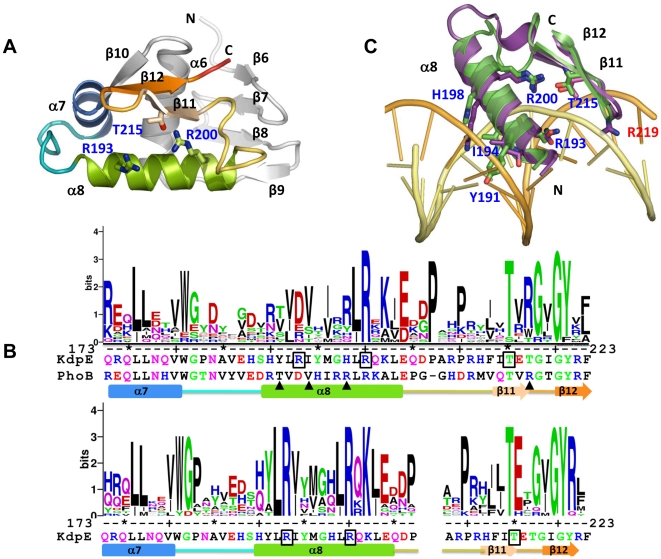
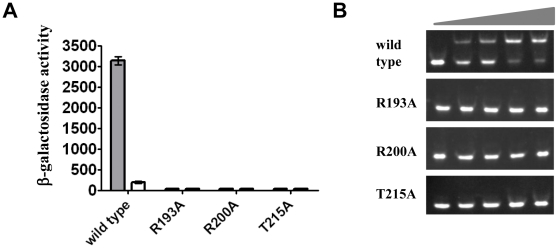
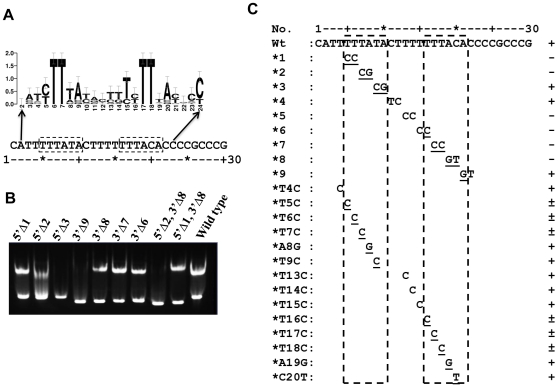
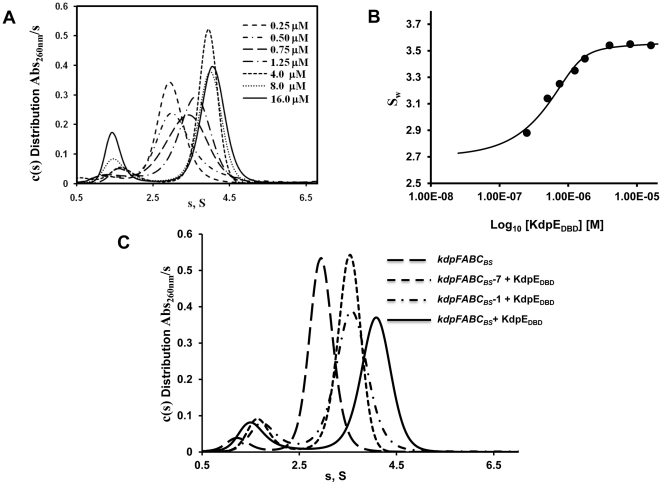
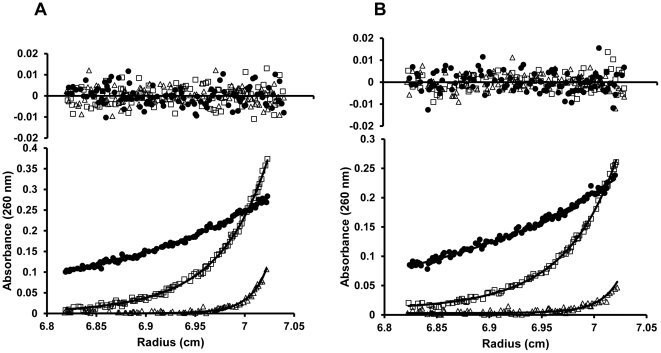
Expression of KdpFABC, a K(+) pump that restores osmotic balance, is controlled by binding of the response regulator KdpE to a specific DNA sequence (kdpFABC(BS)) via the winged helix-turn-helix type DNA binding domain (KdpE(DBD)). Exploration of E. coli KdpE(DBD) and kdpFABC(BS) interaction resulted in the identification of two conserved, AT-rich 6 bp direct repeats that form half-sites. Despite binding to these half-sites, KdpE(DBD) was incapable of promoting gene expression in vivo. Structure-function studies guided by our 2.5 Å X-ray structure of KdpE(DBD) revealed the importance of residues R193 and R200 in the α-8 DNA recognition helix and T215 in the wing region for DNA binding. Mutation of these residues renders KdpE incapable of inducing expression of the kdpFABC operon. Detailed biophysical analysis of interactions using analytical ultracentrifugation revealed a 2∶1 stoichiometry of protein to DNA with dissociation constants of 200±100 and 350±100 nM at half-sites. Inactivation of one half-site does not influence binding at the other, indicating that KdpE(DBD) binds independently to the half-sites with approximately equal affinity and no discernable cooperativity. To our knowledge, these data are the first to describe in quantitative terms the binding at half-sites under equilibrium conditions for a member of the ubiquitous OmpR/PhoB family of proteins.


Conflict of interest statement

Competing Interests: The authors have declared that no competing interests exist.

Figures

Figure 1
Figure 1. Biochemical and functional characterization of KdpEDBD.
A. Sedimentation velocity analysis of the KdpEDBD to detect self-association. The c(s) distribution of the KdpEDBD at 21 (dots), 42 (solid line), and 84 µM (dashes) shows a single species of 1.4 S. No concentration-dependent formation of higher-order species was observed. B. Interaction of KdpEDBD protein with kdpFABCBS and ompFPro DNA sequences analyzed by EMSA. The triangles represent increasing molar ratios of 1∶0, 1∶1, 1∶2, and 1∶3 of DNA to purified KdpEDBD. The lower and upper bands represent free DNA and DNA-KdpEDBD complex, respectively. C. In vivo analysis of expression of the β-galactosidase gene fused to kdpFABCPro. E. coli RH003 cells lacking the histidine kinase (kdpD) and RR (kdpE) were used to express full-length KdpD alone as well as KdpD combined with KdpE or KdpEDBD. As described in the methods, the cells were grown in K0 (▪) and K10 (□) media prior to analysis of gene expression. Growth in K0 medium mimics stresses resulting from external K+ depletion. The β-galactosidase activity expressed as Miller units represents the mean of three independent experiments; error bars represent standard error.
Figure 2
Figure 2. Structure of KdpEDBD.
A. A cartoon representation of a molecule showing the wHTH motif in progressive coloring; the rest is in gray. To maintain continuity with the structure of the N-terminal receiver domain of KdpE , the β-strands and α-helices of KdpEDBD are labeled starting with β-6 and α-6. The side chains shown in stick representation are residues R193 and R200 in α8 and T215 in β11 targeted for mutagenesis. N and C refer to the amino- and carboxyl- termini. B. Conservation of the sequence in the wHTH motif across members of the OmpR/PhoB family (upper panel) and between KdpE orthologs (lower panel) presented in logo format derived from multiple sequence alignments . The Y-axis represents sequence conservation in bits. The residues targeted for mutagenesis in KdpE are boxed, the triangles represent residues involved in base specific interactions in PhoB-DNA complex (PDB code: 1GXP), and the residue numbering is that of KdpE sequence. Shown below the logo representation are the sequences of the wHTH motif of KdpE and PhoB (upper panel) and that of KdpE in the lower panel. The gap in the lower panel represents a three residue insertion in few of the KdpE orthologs used in sequence alignment. The schematic of the secondary structure was derived from the structure of KdpEDBD. C. Superposition of KdpEDBD onto the structure of PhoB bound to DNA (PDB code: 1GXP). Only wHTH motifs of KdpEDBD and chain A of PhoB in 1GXP and part of the DNA are shown. The coloring scheme: green, KdpEDBD; purple, PhoB and yellow/orange, DNA strands. The following side chains of residues of PhoB (and in parenthesis equivalent residues in KdpEDBD labeled in blue) are shown as sticks: T194 (Y191), V197 (I194), R201 (H198) and R219 (T217, not shown), R203 (R200) and T217 (T215) and D196 (R193). Residues T194, V197, R201 and R219 (that penetrates the minor groove is labeled in red) of PhoB have been shown to be form base specific interactions.
Figure 3
Figure 3. Effects of mutation of residues conserved in kdpEDBD.
A. Comparison of β-galactosidase activities of KdpE mutants and wild-type KdpE in the kdpFABCPro-lacZ fusion strain HAK003. Residues located in the α-8 (R193 and R200) and β-hairpin (T215) of KdpE (see Fig. 2) were targeted for mutagenesis to alanine. β-galactosidase (a reporter for kdpFABC expression) was measured in cells grown in media containing either K10 (white bar, 10 mM K+) or K0 (gray bar, 0 mM K+). B. EMSA showing effects of mutations in KdpE on interaction with the 30 bp DNA fragment representing its binding site. The triangles represent increasing molar ratios of 1∶0, 1∶1, 1∶2, 1∶4, and 1∶8 of DNA to purified mutants as indicated and wild-type KdpEDBD.
Figure 4
Figure 4. Identification and characterization of half-sites S1 and S2 on DNA that interacts with KdpEDBD.
A. Sequence logo representation to highlight conserved sequences in a 24 bp stretch of kdpFABCBS. In the logo, the height of the letter represents its frequency of occurrence in a multiple sequence alignment (Fig. S3) and the error bars indicate the sampling error at individual positions. Two 6 bp imperfect direct repeats (TTTATA and TTTACA) separated by a 5 bp sequence are shown in dashed boxes below the logo. B. Identification of the minimal length of DNA required for binding KdpE. For EMSA, double-stranded DNA molecules with progressive deletions (indicated by Δ) at either 5′, 3′, or both ends were used (the nomenclature for oligonucleotides: 5′Δ2, 3′Δ8 (Fig. 4B, lane 9) refers to deletion of 2 and 8 bp from the 5′ and 3′ ends respectively of the wild-type (30 bp) DNA molecule; oligonucleotides used are shown in Table S2). The interpretation of EMSA was qualitative: discreet band shifts as observed in Fig. 4B, lane 1 were considered a positive reaction (+), whereas no shift (Fig. 4B, lane 3) was scored negative (−) and smeared bands as exemplified by Fig. 4B, lane 2 were considered partial binding. C. Effects of changes in DNA sequence on the KdpEDBD-DNA interaction. A summary of EMSA data (data not shown) using the 30 bp kdpFABCBS sequence and modified oligonucleotides (only specific two or one nucleotide substitutions are noted) are presented. The scoring of EMSA analysis was as described above. The dashed boxes represent the 6 bp direct repeats that form half-sites S1 and S2.
Figure 5
Figure 5. Sedimentation velocity analysis of KdpEDBDkdpFABCBS association.
A. Continuous distribution of sedimentation coefficients [c(s)] as a function of increasing concentration of protein against a fixed concentration of kdpFABCBS DNA (0.5 µM). The protein concentrations used varied between 0.25 and 16 µM as shown. The largest complex with sedimentation coefficient of 4.1 S was observed at protein concentration of 4 to 16 µM. Independent experiments established the sedimentation coefficients of KdpEDBD and kdpFABCBS at 1.4 S and 2.8 S respectively (data not shown). B. A plot of the weight average sedimentation coefficients (Sw) against the concentration of KdpEDBD is shown. Analysis of the isotherm indicated that DNA was saturated beginning at 8-fold molar excess of KdpEDBD protein. C. SV c(s) distributions comparing binding of KdpEDBD to the S1 and S2 sites individually and to the both sites simultaneously. Wild-type DNA with both sites intact (kdpFABCBS), functional S1 (kdpFABCBS7) and S2 (kdpFABCBS1) sites were analyzed with a 16-fold molar excess of KdpDBD. Complexes with DNA possessing single sites have sedimentation coefficients of 3.5 S whereas when both sites were occupied a 4.1 S species was formed.
Figure 6
Figure 6. Sedimentation equilibrium analysis of the KdpEDBDkdpFABCBS complex to determine the Kd and stoichiometry.
Representative SE profiles of 0.63 µM kdpFABCBS and 2.5 µM KdpEDBD generated from data collected at 260 nm (A) and 280 nm (B) are shown. Mixtures of KdpEDBD and kdpFABCBS were spun at 9,000 (•), 19,800 (□) and 34,000 (Δ) rpm. The data were fit to a two site binding model with symmetrical sites using SEDPHAT. The root mean square deviation values for the fits were 0.0039 and 0.0034 for samples at 260 and 280 nm, respectively. The residuals (inset) showed no systematic deviations. The fitted values are shown in Tables 2 and 3.
Figure 7
Figure 7. Binding analysis of the half-sites of kdpFABCBS.
SE analysis of binding of KdpEDBD to S1 (kdpFABCBS—7) (A)and S2 (kdpFABCBS1) (B) half-sites revealed a 1∶1 stoichiometry. Mixtures of KdpEDBD and DNA were spun at 9,000 (•), 19,800 (□) and 34,000 (Δ) rpm. The Kds obtained for KdpEDBD binding at half-sites S1 was 350±100 nM and for S2 was 200±100 nM using a one site binding model (AB) in SEDPHAT. The molecular weights calculated from the SE data were 30,000±1,500 for kdpFABCBS—1 and 30,000±2,500 for kdpFABCBS—7.

References

    1. Nixon BT, Ronson CW, Ausubel FM. Two-component regulatory systems responsive to environmental stimuli share strongly conserved domains with the nitrogen assimilation regulatory genes ntrB and ntrC. Proc Natl Acad Sci U S A. 1986;83:7850–7854. - PMC - PubMed
    1. Hoch JA. Two-component and phosphorelay signal transduction. Curr Opin Microbiol. 2000;3:165–170. - PubMed
    1. Stock AM, Robinson VL, Goudreau PN. Two-component signal transduction. Annu Rev Biochem. 2000;69:183–215. - PubMed
    1. Mascher T, Helmann JD, Unden G. Stimulus perception in bacterial signal-transducing histidine kinases. Microbiol Mol Biol Rev. 2006;70:910–938. - PMC - PubMed
    1. Bourret RB. Receiver domain structure and function in response regulator proteins. Curr Opin Microbiol. 2010;13:142–149. - PMC - PubMed

Publication types

MeSH terms

Associated data

LinkOut - more resources