. 2012;7(1):e30176.
doi: 10.1371/journal.pone.0030176. Epub 2012 Jan 24.

A flexible model of HIV-1 latency permitting evaluation of many primary CD4 T-cell reservoirs

Affiliations

A flexible model of HIV-1 latency permitting evaluation of many primary CD4 T-cell reservoirs

Kara G Lassen et al. PLoS One. 2012.

Abstract

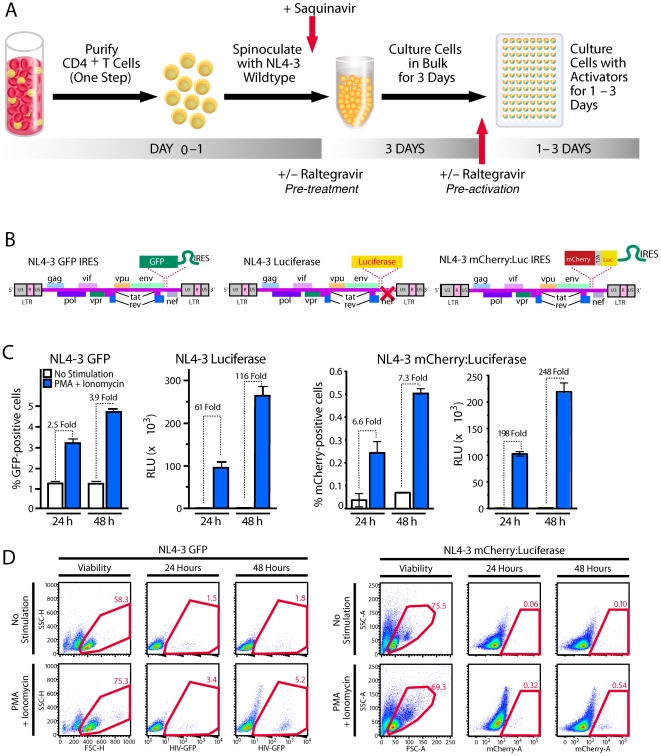
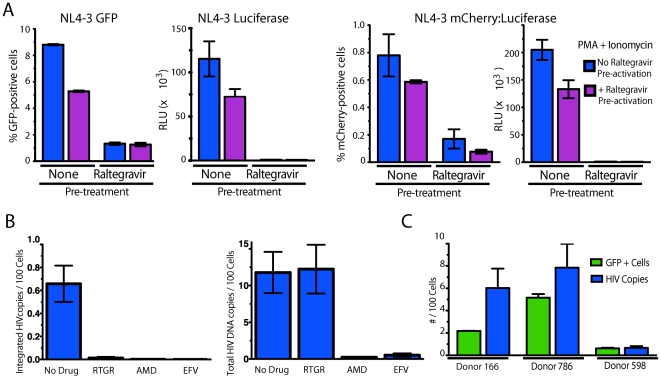
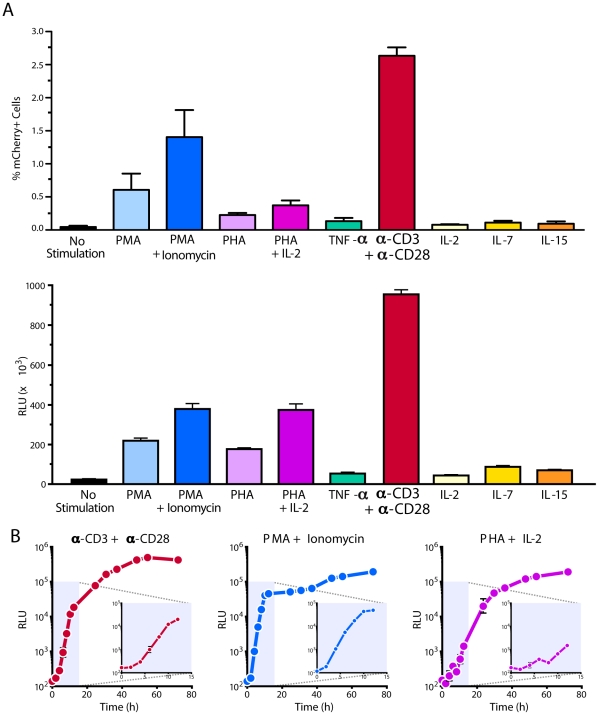
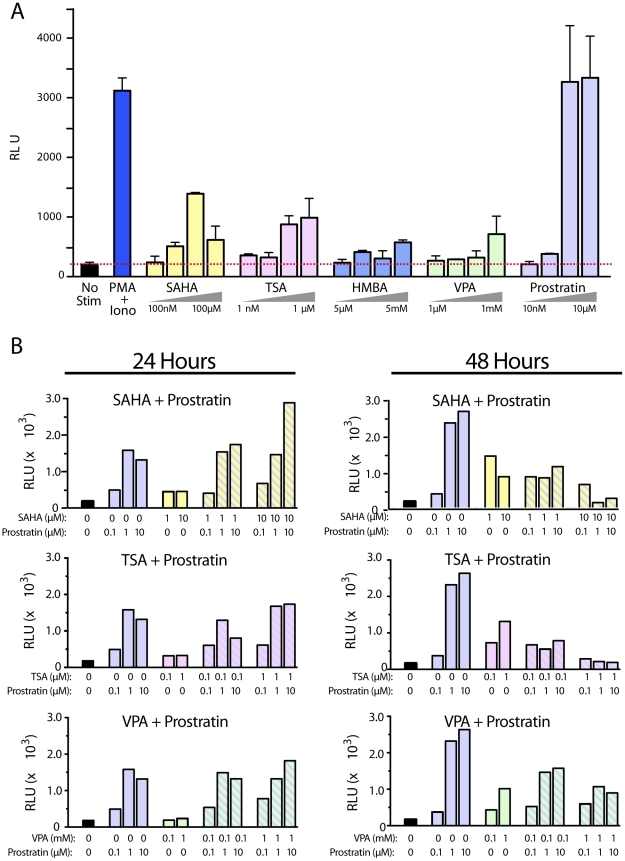
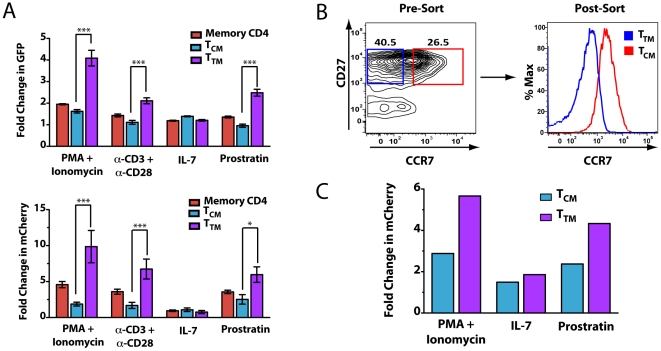
Latently infected cells form the major obstacle to HIV eradication. Studies of HIV latency have been generally hindered by the lack of a robust and rapidly deployable cell model that involves primary human CD4 T lymphocytes. Latently infected cell lines have proven useful, but it is unclear how closely these proliferating cells recapitulate the conditions of viral latency in non-dividing CD4 T lymphocytes in vivo. Current primary lymphocyte models more closely reflect the in vivo state of HIV latency, but they are limited by protracted culture periods and often low cell yields. Additionally, these models are always established in a single latently infected cell type that may not reflect the heterogeneous nature of the latent reservoir. Here we describe a rapid, sensitive, and quantitative primary cell model of HIV-1 latency with replication competent proviruses and multiple reporters to enhance the flexibility of the system. In this model, post-integration HIV-1 latency can be established in all populations of CD4 T cells, and reactivation of latent provirus assessed within 7 days. The kinetics and magnitude of reactivation were evaluated after stimulation with various cytokines, small molecules, and T-cell receptor agonists. Reactivation of latent HIV proviruses was readily detected in the presence of strong activators of NF-κB. Latently infected transitional memory CD4 T cells proved more responsive to these T-cell activators than latently infected central memory cells. These findings reveal potentially important biological differences within the latently infected pool of memory CD4 T cells and describe a flexible primary CD4 T-cell system to evaluate novel antagonists of HIV latency.


Conflict of interest statement

Competing Interests: The authors have declared that no competing interests exist.

Figures

Figure 1
Figure 1. Establishing postintegration HIV-1 latency in primary CD4 T cells and reactivating virus.
(A) Production of a primary cell model of HIV-1 latency. Total CD4 T cells were isolated from PBMC with a single-step negative-selection procedure with magnetic beads to remove unwanted cell subpopulations. Within 24 h, isolated cells were spinoculated at 1200× g for 2 h at room temperature with viral supernatants corresponding to NL4-3 GFP IRES Nef, NL4-3 Luciferase, or NL4-3 mCherry:Luciferase viruses as schematically depicted in (B). After spinoculation, cells were placed in medium containing 5 µM saquinavir and cultured for 3 days. Cells are then counted and plated in 96-well plates in medium containing 30 µM raltegravir and various stimulators. (C) Reactivation profiles of cells latently infected with NL4-3 GFP IRES Nef, NL4-3 Luciferase, or NL4-3 mCherry:Luciferase. Latently infected cells were cultured with medium alone or medium containing 200 nM PMA and 1.5 µM ionomycin and harvested after 24 or 48 hours of culture. GFP- or mCherry-expressing cells were quantified by flow cytometry, and the percentage of GFP+ or mCherry cells was calculated based on uninfected controls. Luciferase levels are reported as relative light units (RLU) and have been normalized to total protein content in cell lysates to control for different cell proliferation rates. All samples were analyzed in triplicate with error bars representing +/− SD. Results are representative of those obtained in analyses of at least 10 independent donors with each virus. (D) Flow cytometric gating and analysis of cells latently infected with NL4-3 GFP IRES Nef or NL4-3 mCherry:Luciferase 24 or 48 hours after stimulation with PMA and ionomycin. Forward scatter versus side scatter plots show cells infected with virus and left unstimulated or stimulated for 24 h.
Figure 2
Figure 2. Latently infected cells harbor integrated proviruses.
(A) Cells were cultured in the presence (pre-treatment) or absence (no pre-treatment) of 30 µM raltegravir that was added immediately after spinoculation. After 3 days, cells were washed and stimulated with PMA+ionomycin in the presence or absence of 30 µM raltegravir (pre-activation). Results are representative of data obtained using three independent donors with each reporter virus. Error bars represent +/−SD of triplicate experiments. (B) CD4 T cells were isolated and pre-treated with 30 µM raltegravir, 250 nM AMD3100, 100 nM Efavirenz, or medium alone for 30 min before spinoculation. Cells were spinoculated and then cultured in the presence or absence of each antiretroviral drug. Three days after spinoculation, total DNA was isolated from the cells, and levels of HIV integration were determined by Alu-gag qPCR (left panel) or levels of total HIV DNA were determined by gag qPCR (right panel). Viral integration levels were compared in cultures incubated in medium alone versus in the presence of raltegravir (RTGR), AMD3100 (AMD), or Efavirenz (EFV) antiviral drugs to confirm the specificity of the assay. Data shown represent an average of six replicate PCR samples +/− SD. Data are presented as the number of copies of HIV DNA per 100 cells. (C) Three days after spinoculation, cells were either lysed for DNA isolation or stimulated with PMA+ionomycin for 24–72 hours. Peak GFP expression data are shown as the mean of three replicate samples. HIV integration was analyzed by Alu-gag qPCR to specifically detect integrated proviral DNA, and levels were normalized to levels obtained for the single copy RNaseP gene. Data shown are average of six replicate PCR samples +/− SD. Data are presented as copies of integrated HIV DNA/100 cells and the number of GFP+ cells/100 cells.
Figure 3
Figure 3. Kinetics of HIV-1 reactivation.
(A) Latently infected cells were generated as described in Figure 1 with NL4-3 Luciferase virus or NL4-3 mCherry:Luc virus. Cells were either cultured in the presence of media alone or stimulated with 200 nM PMA, 200 nM PMA and 1.5 µM ionomycin, 10 µg/ml PHA, 10 µg/ml PHA with 100 units/ml IL-2, 10 ng/ml TNF-α, anti-CD3+anti-CD28 beads (ratio 1∶1), 100 units/ml IL-2, 62.5 ng/ml IL-7, or 12.5 ng/ml IL-15. Cells were harvested after 48 h of stimulation. RLU shown were normalized based on total protein present in the various cell lysates. All stimulations were performed in triplicate with error bars representing +/− SD. Results are representative of experiments performed with cells from four independent donors. (B) Latently infected cells from the same individual donor were stimulated with anti-CD3+anti-CD28 beads (ratio 1∶1), 200 nM PMA with 1.5 µM ionomycin, or 10 µg/ml PHA with 100 units/ml IL-2 and harvested at the indicated times post-stimulation. Results are representative of kinetic experiments performed with cells isolated from three independent donors.
Figure 4
Figure 4. Multiplex screening of inducing compounds on the reactivation of HIV-1 latency.
(A) Latently infected cells were stimulated with 10-fold increasing concentrations of SAHA, TSA, HMBA, VPA, or prostratin. Cells were treated with 200 nM PMA+1.5 µM ionomycin as a positive control. The highest and lowest concentrations of the 10-fold dilution series are indicated for each compound tested. Stimulations were performed in triplicate reactions and error bars represent +/− SD. (B) Cells were treated for 24 or 48 h with the indicated concentration of compounds. Results are representative of independent experiments performed with at least three independent donors.
Figure 5
Figure 5. Analyses of reactivation profiles in latently infected transitional memory and central memory CD4 T cells.
(A) CD4+CD45RO+ cells were purified by single step negative selection and HIV latency was established in these cells as described above. Cells were plated in 96-well plates and stimulated with 200 nM PMA with 1.5 µM ionomycin, anti-CD3+anti-CD28 beads (ratio 1∶1), 62.5 ng/ml IL-7, 10 µM prostratin, or left unstimulated for 24 h. Cells were stained with CD45RA-APC-H7, CCR7-PE-Cy7, CD27-APC, and CD45RO-FITC (NL4-3 mCherry:Luc) or CD45RO-PE (NL4-3 GFP), and analyzed for receptor expression and viral reporter expression. To obtain fold stimulation ratios, data were normalized as the percentage of cells expressing the viral reporter with the indicated stimulation divided by the % cells expressing the viral reporter in the absence of stimulation. Data shown represent an average of results obtained from four independent donors for each viral construct. Error bars represent +/− SEM. (B) CD4+CD45RO+ cells (upper panel) were sorted for CCR7+CD27+ central memory cells (TCM) and CCR7-CD27+ transitional memory cells (TTM). Cells were cultured for 2 days and then infected by spinoculation of NL4-3 mCherry:Luc. At the time of infection, cells were analyzed by flow cytometry for receptor expression to determine the relative levels of CCR7 expression in each sorted population (lower panel). (C) Latently infected cells were either left unstimulated or stimulated for 30 h with the indicated inducers. Two independent donors are shown, and fold change was determined as described above for luciferase levels.

References

    1. Chun TW, Carruth L, Finzi D, Shen X, DiGiuseppe JA, et al. Quantification of latent tissue reservoirs and total body viral load in HIV-1 infection. Nature. 1997;387:183–188. - PubMed
    1. Wong JK, Hezareh M, Gunthard HF, Havlir DV, Ignacio CC, et al. Recovery of replication-competent HIV despite prolonged suppression of plasma viremia. Science. 1997;278:1291–1295. - PubMed
    1. Carter CC, Onafuwa-Nuga A, McNamara LA, Riddell Jt, Bixby D, et al. HIV-1 infects multipotent progenitor cells causing cell death and establishing latent cellular reservoirs. Nat Med. 2010;16:446–451. - PMC - PubMed
    1. Finzi D, Blankson J, Siliciano JD, Margolick JB, Chadwick K, et al. Latent infection of CD4+ T cells provides a mechanism for lifelong persistence of HIV-1, even in patients on effective combination therapy. Nat Med. 1999;5:512–517. - PubMed
    1. Siliciano JD, Kajdas J, Finzi D, Quinn TC, Chadwick K, et al. Long-term follow-up studies confirm the stability of the latent reservoir for HIV-1 in resting CD4+ T cells. Nat Med. 2003;9:727–728. - PubMed

Publication types

MeSH terms