Randomized Controlled Trial
. 2012;7(1):e30845.
doi: 10.1371/journal.pone.0030845. Epub 2012 Jan 23.

Efficient coding and statistically optimal weighting of covariance among acoustic attributes in novel sounds

Affiliations
Randomized Controlled Trial

Efficient coding and statistically optimal weighting of covariance among acoustic attributes in novel sounds

Christian E Stilp et al. PLoS One. 2012.

Abstract

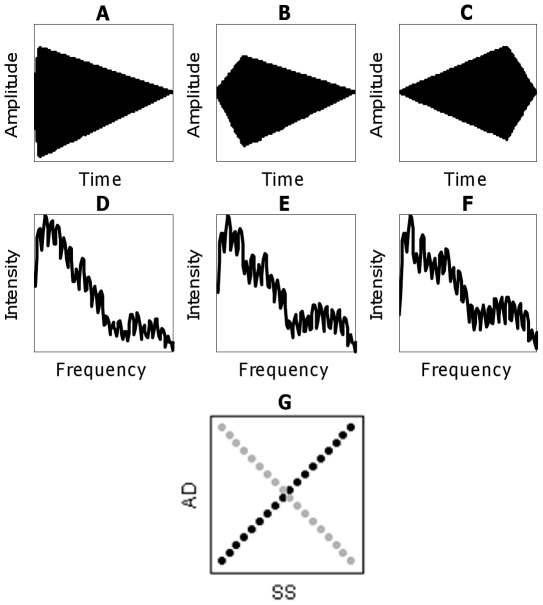
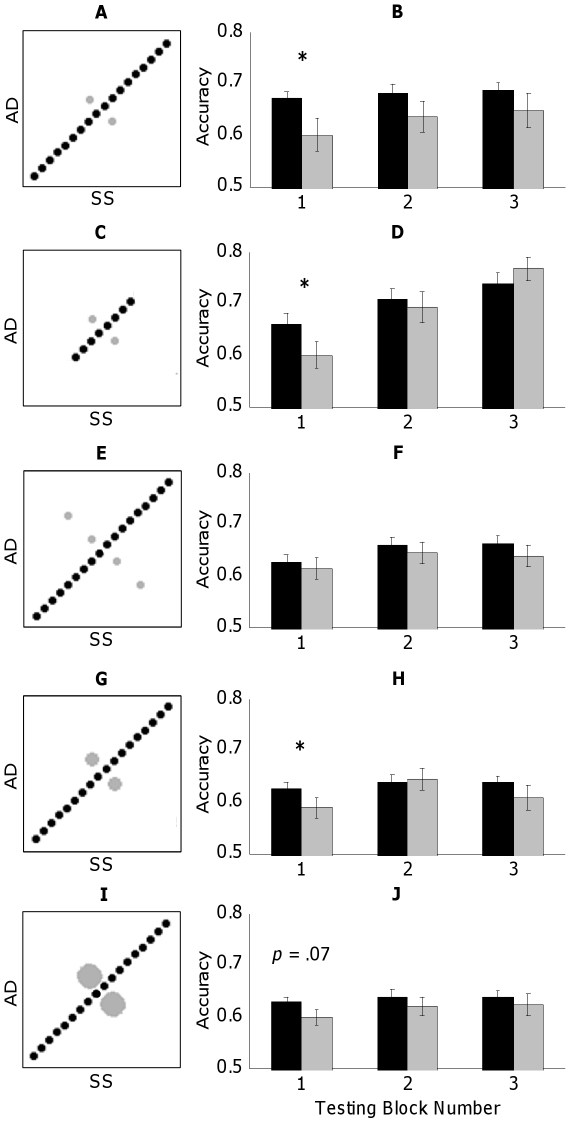
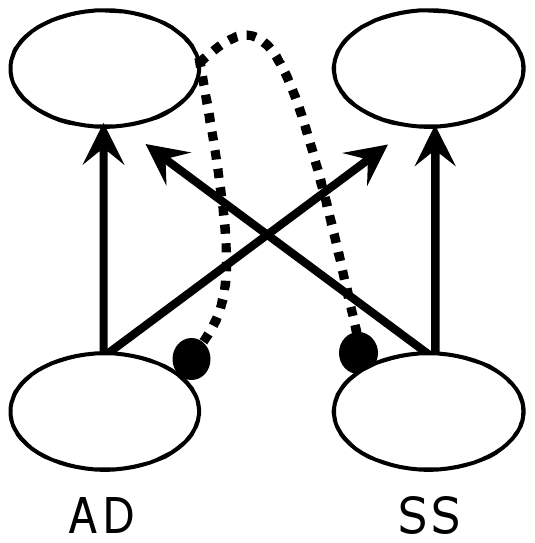
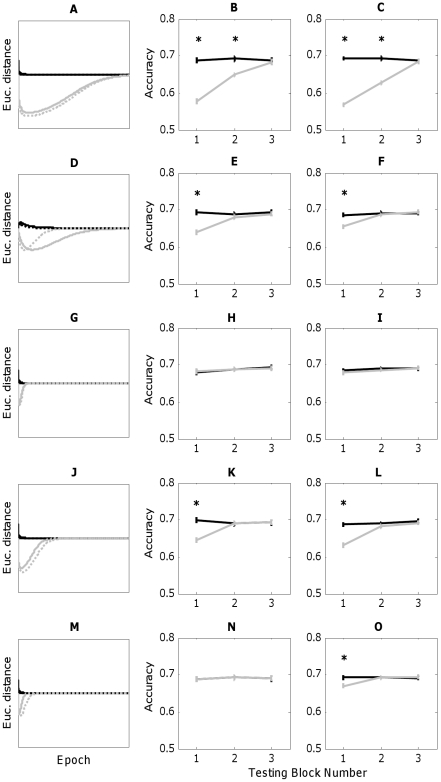
To the extent that sensorineural systems are efficient, redundancy should be extracted to optimize transmission of information, but perceptual evidence for this has been limited. Stilp and colleagues recently reported efficient coding of robust correlation (r = .97) among complex acoustic attributes (attack/decay, spectral shape) in novel sounds. Discrimination of sounds orthogonal to the correlation was initially inferior but later comparable to that of sounds obeying the correlation. These effects were attenuated for less-correlated stimuli (r = .54) for reasons that are unclear. Here, statistical properties of correlation among acoustic attributes essential for perceptual organization are investigated. Overall, simple strength of the principal correlation is inadequate to predict listener performance. Initial superiority of discrimination for statistically consistent sound pairs was relatively insensitive to decreased physical acoustic/psychoacoustic range of evidence supporting the correlation, and to more frequent presentations of the same orthogonal test pairs. However, increased range supporting an orthogonal dimension has substantial effects upon perceptual organization. Connectionist simulations and Eigenvalues from closed-form calculations of principal components analysis (PCA) reveal that perceptual organization is near-optimally weighted to shared versus unshared covariance in experienced sound distributions. Implications of reduced perceptual dimensionality for speech perception and plausible neural substrates are discussed.


Conflict of interest statement

Competing Interests: The authors have declared that no competing interests exist.

Figures

Figure 1
Figure 1. Example stimuli used in the present experiments.
The first row shows steps 1 (A; shortest attack/longest decay), 9 (B; intermediate attack/decay) and 18 (C; longest attack/shortest decay) out of 18 in the AD series. The second row shows steps 1 (D; most-French-horn-like), 9 (E; intermediate mixture) and 18 (F; most-tenor-saxophone-like) out of 18 in the SS series, with frequency axes magnified (shown only up to 6 kHz) to emphasize differences in spectral envelopes. The third row shows examples of the two experimental conditions. Black circles depict stimuli that obey a positive correlation between AD and SS (i.e., lie on a main diagonal of the stimulus matrix; Consistent condition). Grey circles depict stimuli that violate that correlation (i.e., lie on the perpendicular diagonal; Orthogonal condition). Examples in 1G depict no overall correlation between AD and SS, but experiments present a high ratio of Consistent∶Orthogonal sounds to introduce correlation among complex acoustic attributes. In counterbalanced conditions, grey sounds support a negative correlation between AD and SS while black sounds directly violate it. Figures 1A and 1D correspond to the black circle in the lower-left corner of 1G, figure 1C to the grey circle in the upper-left corner, and figure 1F to the grey circle in the lower-right corner.
Figure 2
Figure 2. Stimuli and behavioral results for all experiments (black = Consistent condition, grey = Orthogonal condition).
Stimulus representations follow Figure 1G. While only positive correlations are shown, experiments were counterbalanced between positive and negative correlations. All behavioral results depict proportion correct discrimination on the ordinate and testing block number on the abscissa. Stimuli (A) and results (B) for Experiment 1 (base design; r = ±0.98). Stimuli (C) and results (D) for Experiment 2 (truncation of evidence supporting the correlation; r = ±0.81). Stimuli (E) and results (F) for Experiment 3 (expansion of evidence supporting the orthogonal dimension; r = ±0.83). Stimuli (G) and results (H) for Experiment 4 (threefold increase in sampling Orthogonal stimuli; r = ±0.95). Stimuli (I) and results (J) for Experiment 5 (tenfold increase in sampling Orthogonal stimuli; r = ±0.83). * indicates significant difference (p<.05) as assessed by paired-sample two-tailed t-tests.
Figure 3
Figure 3. PCA network architecture.
Two input units (one corresponding to AD, one to SS) are fully connected to two output units via feed-forward excitatory weights (solid arrows) without any hidden layer or bias. The first output unit projects inhibitory weights (dashed lines) back to the inputs, effectively removing the principal component from the inputs and leaving the second output to encode remaining (orthogonal) covariance. Euclidean distances among output patterns were calculated after each epoch.
Figure 4
Figure 4. PCA network simulations (left column) and choice model performance (center, right columns) for all experiments (black = Consistent condition, grey = Orthogonal condition).
The first row corresponds to Experiment 1, the second row to Experiment 2, etc. In PCA simulations (A, D, G, J, M), Euclidean distance between test stimuli is on the ordinate and simulation epoch on the abscissa. Solid lines portray predictions made by the correlation-based model, while (often highly overlapping) dashed lines portray predictions of the covariance-based model. Choice model performance (center, right columns) plots proportion correct discrimination on the ordinate and testing block number on the abscissa. Choice model performance based on the correlation-based PCA model is shown in the center column (B, E, H, K, N), and performance based on the covariance-based PCA model is shown in the right column (C, F, I, L, O). Choice model patterns of performance for both correlation and covariance are identical for Experiments 1–4. However, the correlation model fails to predict listeners' superior discrimination of statistically consistent sound pairs (O) early in Experiment 5 (N) while the covariance-based model successfully predicts this performance.
Figure 5
Figure 5. The choice model of Xu et al. , where the probability of error in a two-alternative forced-choice (AXB) task decreases exponentially with increasing distance between stimuli (solid line).
Dashed lines correspond to error probability of 0.31, or baseline discriminability between experimental stimuli absent effects of correlation among attributes , and the corresponding inter-stimulus distance.

References

    1. Attneave F. Some informational aspects of visual perception. Psych Rev. 1954;61:183–193. - PubMed
    1. Barlow HB. NPL Symposium on the Mechanization of Thought Process. London: HM Stationery Office; 1959. Sensory mechanisms, the reduction of redundancy, and intelligence. pp. 535–539. 10:
    1. Barlow HB. Possible principles underlying the transformations of sensory messages. In: Rosenblith WA, editor. Sensory Communication. Cambridge: MIT Press, New York: John Wiley; 1961. pp. 53–85.
    1. Fairhall AL, Lewen GD, Bialek W, de Ruyter van Steveninck RR. Efficiency and ambiguity in an adaptive neural code. Nature. 2001;412:787–792. - PubMed
    1. Olshausen BA, Field DJ. Emergence of simple-cell receptive field properties by learning a sparse code for natural images. Nature. 1996a;381:607–609. - PubMed

Publication types