. 2012 Mar;122(3):899-910.
doi: 10.1172/JCI45817. Epub 2012 Feb 1.

Matrix architecture defines the preferential localization and migration of T cells into the stroma of human lung tumors

Affiliations

Matrix architecture defines the preferential localization and migration of T cells into the stroma of human lung tumors

Hélène Salmon et al. J Clin Invest. 2012 Mar.

Abstract

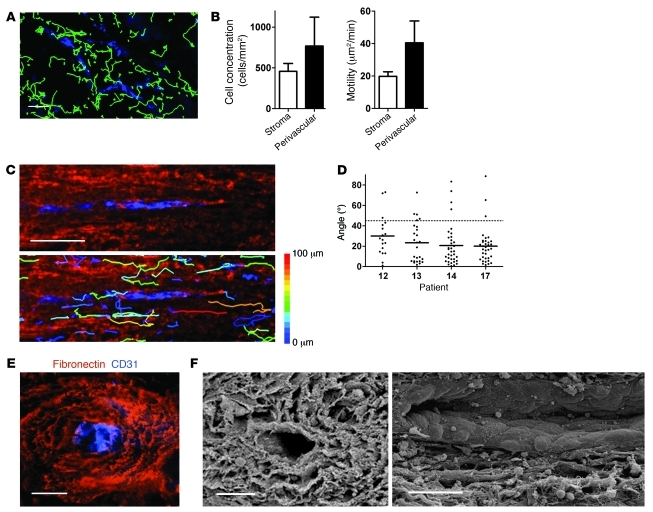
Appropriate localization and migration of T cells is a prerequisite for antitumor immune surveillance. Studies using fixed tumor samples from human patients have shown that T cells accumulate more efficiently in the stroma than in tumor islets, but the mechanisms by which this occurs are unknown. By combining immunostaining and real-time imaging in viable slices of human lung tumors, we revealed that the density and the orientation of the stromal extracellular matrix likely play key roles in controlling the migration of T cells. Active T cell motility, dependent on chemokines but not on β1 or β2 integrins, was observed in loose fibronectin and collagen regions, whereas T cells migrated poorly in dense matrix areas. Aligned fibers in perivascular regions and around tumor epithelial cell regions dictated the migratory trajectory of T cells and restricted them from entering tumor islets. Consistently, matrix reduction with collagenase increased the ability of T cells to contact cancer cells. Thus, the stromal extracellular matrix influences antitumor immunity by controlling the positioning and migration of T cells. Understanding the mechanisms by which this collagen network is generated has the potential to aid in the development of new therapeutics.


Figures

Figure 1
Figure 1. T cells preferentially migrate into the tumor stroma.
(A) Preactivated T cells (Hoechst; green) were added to a human lung tumor slice that was subsequently stained for fibronectin and EpCAM to respectively identify stromal (red) and tumor epithelial cell (blue) regions. Each image, captured with a widefield microscope, is the maximum projection of 4 images spanning 60 μm in the z direction beneath the cut surface of the slice. (B) Concentration of in vitro activated T cells and resident CD3+ cells in the stromal and tumor cell regions. (C) Concentration of in vitro activated PBTs and freshly isolated autologous TILs in the stromal and tumor cell regions. (D) Trajectories of individual T cells in the stromal (red) and tumor cell (blue) regions. Fluorescently labeled T cells introduced into a human tumor slice were imaged for 20 minutes, after which the slice was stained for fibronectin and EpCAM. Trajectories were superimposed over immunofluorescence images. Tracks are color coded according to extent of cell displacement. See also Supplemental Video 1. (E) Motility coefficient of T cells in the stromal and tumor cell regions. Values are mean ± SD of data obtained in slices from 7 (B and E) or 4 (C) different human lung tumors. *P < 0.05; **P < 0.01; ***P < 0.001. Scale bars: 100 μm (A); 50 μm (D).
Figure 2
Figure 2. T cells are able to infiltrate tumor islets expressing CCL5.
(A) SEM images of 2 different tumors from lung cancer patients, showing cohesive tumor cells. (B) Representative image of a human lung tumor slice stained for EpCAM (blue) and CD3 (red), demonstrating resident T cell exclusion from the compact tumor epithelium. (C) Fluorescently labeled T cells (Hoechst; red) from a tumor-specific clone were plated onto the slice of an autologous lung tumor engrafted into an immune-incompetent mouse. Tumor cells were identified by staining for E-cadherin (blue), or autologous tumor cells were transfected with a construct coding for CCL5-GFP (green) before their implantation. Images were captured as in Figure 1A. See also Supplemental Video 2. (D) Proportion of fluorescently labeled T cells in tumor cell regions expressing or lacking CCL5 compared with the stroma. Only cells localized 10 μm below the surface of the slice were included in the analysis. Values are mean ± SD of 5 experiments in which T cells were scored from at least 3 tumor slices. ***P < 0.001. Scale bars: 5 μm (A); 100 μm (B and C).
Figure 3
Figure 3. T cell migration within human lung tumor slices is partially inhibited by PTX.
(A) Tracks of individual suB- (green) or PTX-treated (red) T cells in a human lung tumor slice during a 20-minute recording with a widefield microscope. T cells were incubated for 2 hours with 100 ng/ml suB or PTX, labeled with CMFDA and Hoechst, respectively, and overlaid on a tumor slice. Stroma was identified by staining for fibronectin (not shown). (B) Motility coefficient of suB- and PTX-treated T cells within the whole stroma and within hot spots, in which lymphocyte motility was favored (see D). Values are mean and SD from experiments performed on tumor slices from 5 different lung cancer patients. At least 100 cells were analyzed per experiment. (C) Tracks of individual suB- (green) and PTX-treated (red) T cells measured in a microscopic field of a human lung tumor slice during a 20-minute recording. 7 200-μm × 200-μm adjacent stromal regions (R1–R7) are indicated. (D) Motility coefficient of suB- and PTX-treated T cells analyzed within the 7 adjacent stromal regions in C. Dashed lines denote the 10-μm2/min threshold for hot spots. **P < 0.01. Scale bars: 50 μm (A); 100 μm (C).
Figure 4
Figure 4. Matrix fiber density strongly influences the localization and migration of T cells.
(A) SHG signal (red) from a human lung tumor slice also stained for CD3 (green) and EpCAM (blue), showing accumulation of resident T cells in collagen-sparse regions (dashed lines). Arrows denote elongated T cells positioned between collagen fibers. Images were captured with a 2-photon microscope. (B) Automatically scored number of resident T cells in 75-μm × 75-μm zones, showing percent SHG-free area (see Supplemental Figure 5). Results were obtained on slices from 3 different lung tumors. (C) Representative image of a human lung tumor slice stained for fibronectin (red) and CD3 (green). A fibronectin-sparse area enriched in T cells is shown (dashed outline). (D) Automatically scored number of resident T cells in adjacent 75-μm × 75-μm zones, showing percent fibronectin-free area. Results were obtained on slices from 5 different lung tumors. (E) Trajectories of individual T cells in a human tumor slice poststained for fibronectin during a 20-minute recording. Tracks are color coded according to extent of cell displacement. A stromal region characterized by a loose fibronectin network is shown (dashed outline). See also Supplemental Video 3. (F) Motility coefficient and concentration of fluorescently labeled T cells in dense and loose fibronectin regions. Values are mean and SD from experiments performed on slices from 6 different tumor specimens. *P < 0.05; **P < 0.01. Scale bars: 50 μm (A); 100 μm (C and E).
Figure 5
Figure 5. Blocking the interactions of β1 and β2 integrins with their ligands does not affect T cell migration in the stroma of human lung tumors.
(A) Anti–β1 integrin and anti–β2 integrin Abs strongly inhibited adhesion of activated PBTs on VCAM-1 and ICAM-1. T cells pretreated or not with 10 μg/ml anti–β2 integrin mAb or anti–β1 integrin mAb were allowed to adhere on ICAM-1 or VCAM-1 layers for 10 minutes. After several washes, the number of remaining T cells was scored. Values are mean and SD from 3 different experiments. (B) Tracks of individual T cells treated (red) or not (green) with 10 μg/ml anti–β1 integrin and anti–β2 integrin mAbs in a human lung tumor slice during a 20-minute recording with a widefield microscope. (C) Motility coefficient of control and Ab-treated T cells within the tumor stroma. Values are mean and SD from experiments performed on tumor slices from 3 different lung cancer patients. At least 100 cells were analyzed per experiment. *P < 0.05; **P < 0.01. Scale bar: 100 μm.
Figure 6
Figure 6. T cells actively migrate in perivascular regions of human lung tumors.
(A) Individual T cell trajectories (Hoechst; green) in a human lung tumor slice poststained for CD31 to reveal blood vessels (blue), during a 20-minute recording with a widefield microscope. (B) Motility coefficient and density of T cells in the whole stroma and in perivascular stromal regions. Values are mean and SD from experiments performed on slices from 4–9 different human lung tumors. (C) Higher-magnification individual T cell trajectories in a human lung tumor slice poststained for fibronectin (red) and CD31 (blue) during a 20-minute recording. Tracks are color coded according to extent of cell displacement. Note the linear migration of T cells along fibers surrounding the vessel. See also Supplemental Video 7. (D) Angle between vessel axis and trajectory vector of individual T cells during a 20-minute recording, measured in slices from 4 different tumor specimens. Cells that migrated less than 10 μm were excluded from analysis. Dashed line denotes 45°, the expected result from a cell population migrating with no directional bias. (E) Representative image of a human lung tumor slice stained for fibronectin (red) and CD31 (blue), showing layers of fibers surrounding the blood vessel. (F) SEM cross-section (left) and longitudinal (right) images of human lung tumor slices, showing the outer layer of the vessel. Scale bars: 100 μm (A and C); 50 μm (E and F).
Figure 7
Figure 7. Matrix fibers surrounding tumor islets restrict T cells from contacting tumor cells.
(A) Representative image of a human lung tumor slice stained for fibronectin (red), EpCAM (blue), and CD3 (green), demonstrating the presence of parallel fibers adjacent to the tumor cell regions. (B) Representative SEM image showing ECM strands parallel to the tumor cell regions. (C) Motility pattern of T cells (Hoechst; green) introduced into a human lung tumor slice stained for fibronectin (red) and EpCAM (blue). Also shown are tracks (middle) and trajectory vectors (right) during a 20-minute recording. (D) Angle between tumor-stroma boundary and trajectory vector of individual T cells, measured in tumor slices from 4 different lung cancer patients. Dashed line denotes 45°, the expected result from a cell population migrating with no directional bias. (E) Migration pattern of T cells in stromal regions adjacent to the tumor-stroma interface. Graphs represent the proportion of tracks whose end positions after the 20-minute recording were within each 90° segment (left scheme). The starting position of each cell was set at the x-y axis intersection, with the x axis parallel to the tumor-stroma boundary. Dashed lines denote 22.5°, the expected result from a cell population migrating with no directional bias. (F) Gap size between fibronectin fibers in 50-μm increments from the tumor islets. Values in E and F are mean and SD from experiments performed on tumor slices from 4 different lung cancer patients. ***P < 0.001. Scale bar: 50 μm (A); 10 μm (B); 100 μm (C).
Figure 8
Figure 8. Collagenase enhances the number of T cells in contact with tumor cells.
(A) Human lung tumor slices were treated or not with collagenase (0.5 mg/ml) for 30 minutes. In vitro activated PBTs loaded with a fluorescent dye (Hoechst; green) were added to the slices, which were subsequently stained for EpCAM (blue) to identify tumor cell regions. SHG (red) was used to visualize the collagen network. Each image, captured with a 2-photon microscope, is the maximum projection of 10 images spanning 100 μm in the z direction beneath the cut surface of the slice. Dotted white line denotes the first 75 μm of the stromal region adjacent to the tumor islet. (B) Number of T cells in 75-μm × 75-μm zones adjacent to tumor cell regions. (C) Number of T cells in contact with peripheral cancer cells along the tumor-stroma boundary. Values in B and C are mean and SD from experiments performed on tumor slices from 3 different lung cancer patients. ***P < 0.001. Scale bars: 50 μm.

References

    1. Frey AB, Monu N. Signaling defects in anti-tumor T cells. Immunol Rev. 2008;222(1):192–205. doi: 10.1111/j.1600-065X.2008.00606.x. - DOI - PMC - PubMed
    1. Gajewski TF, et al. Immune resistance orchestrated by the tumor microenvironment. Immunol Rev. 2006;213(1):131–145. doi: 10.1111/j.1600-065X.2006.00442.x. - DOI - PubMed
    1. Chen Q, Wang WC, Evans SS. Tumor microvasculature as a barrier to antitumor immunity. Cancer Immunol Immunother. 2003;52(11):670–679. doi: 10.1007/s00262-003-0425-4. - DOI - PMC - PubMed
    1. Clark RA, et al. Human squamous cell carcinomas evade the immune response by down-regulation of vascular E-selectin and recruitment of regulatory T cells. J Exp Med. 2008;205(10):2221–2234. doi: 10.1084/jem.20071190. - DOI - PMC - PubMed
    1. Ohtani H. Focus on TILs: prognostic significance of tumor infiltrating lymphocytes in human colorectal cancer. Cancer Immun. 2007;7:4. - PMC - PubMed

Publication types