. 2012 Mar;122(3):911-22.
doi: 10.1172/JCI58215. Epub 2012 Feb 1.

Heparan sulfate sulfatase SULF2 regulates PDGFRα signaling and growth in human and mouse malignant glioma

Affiliations

Heparan sulfate sulfatase SULF2 regulates PDGFRα signaling and growth in human and mouse malignant glioma

Joanna J Phillips et al. J Clin Invest. 2012 Mar.

Abstract

Glioblastoma (GBM), a uniformly lethal brain cancer, is characterized by diffuse invasion and abnormal activation of multiple receptor tyrosine kinase (RTK) signaling pathways, presenting a major challenge to effective therapy. The activation of many RTK pathways is regulated by extracellular heparan sulfate proteoglycans (HSPG), suggesting these molecules may be effective targets in the tumor microenvironment. In this study, we demonstrated that the extracellular sulfatase, SULF2, an enzyme that regulates multiple HSPG-dependent RTK signaling pathways, was expressed in primary human GBM tumors and cell lines. Knockdown of SULF2 in human GBM cell lines and generation of gliomas from Sulf2(-/-) tumorigenic neurospheres resulted in decreased growth in vivo in mice. We found a striking SULF2 dependence in activity of PDGFRα, a major signaling pathway in GBM. Ablation of SULF2 resulted in decreased PDGFRα phosphorylation and decreased downstream MAPK signaling activity. Interestingly, in a survey of SULF2 levels in different subtypes of GBM, the proneural subtype, characterized by aberrations in PDGFRα, demonstrated the strongest SULF2 expression. Therefore, in addition to its potential as an upstream target for therapy of GBM, SULF2 may help identify a subset of GBMs that are more dependent on exogenous growth factor-mediated signaling. Our results suggest the bioavailability of growth factors from the microenvironment is a significant contributor to tumor growth in a major subset of human GBM.


Figures

Figure 1
Figure 1. SULF2 expression in human GBM.
(A and B) In silico analysis of SULF2 and SULF1 expression in 16 human GBM tumor samples (49). Each bar represents normalized expression (y axis), as number of SAGE tags per million tags, for each patient tumor listed on the x axis. Expression in normal (Nl) brain is shown in each graph. (C) Increased SULF2 expression in 197/424 (46%) primary GBM tumors, log2(tumor/normal) greater than 1.0 (fold change of tumor versus normal greater than or equal to 2.0). See also Supplemental Figure 1 and Supplemental Table 1. (D) Western blot analysis of 6 human high-grade astrocytoma cell lines for SULF2 (~135 kDa). 293T cells with or without expression of mSULF2 were used as positive (+) and negative (–) controls. (E) Distribution of SULF2 protein expression in 57 primary human GBM tumors by immunohistochemistry. The percentage of SULF2-positive tumor cells was scored from no positive cells (score 0) to more than 75% of tumor cells positive (score 3) (see Methods). (FI) Representative images from 2 SULF2-positive tumors (F, G, and I) and a SULF2-negative tumor (H). SULF2-positive (brown) tumor cells (F) were widely distributed except in occasional tumors that displayed a more prominent perivascular distribution (G). Many SULF2-positive (brown) tumor cells were also OLIG2-positive (red). See also Supplemental Figure 2. (I) Examples of SULF2-positive tumor cells (arrowheads) and microvascular proliferation characteristic of GBM (arrow). Scale bars: 50 μm (FH); 10 μm (I).
Figure 2
Figure 2. SULF2 confers a growth advantage to human GBM cells in vitro and in vivo.
(A) Knockdown of SULF2 in U251 cells by 2 different shRNA constructs; SULF2 is decreased by 83% with shRNA SULF2-A and 55% with SULF2-B compared with the scrambled shRNA control. (B) In vitro growth of EGFP-positive SULF2-A shRNA (shSULF2-A) and scrambled shRNA control (shControl) cells demonstrated a selective growth advantage of SULF2-expressing cells over cells with SULF2 knockdown, as demonstrated by a decreased ratio of GFP-positive to total cells over time. *P < 0.01; n = 3. (C and D) Decreased growth and cell viability of SULF2-A shRNA cells versus scrambled shRNA control cells, as determined by counting live cells over time (*P < 0.00005; n = 3) (C) and by the colorimetric MTT viability assay, viable cell number normalized to control, day 5 after plating (*P < 0.00005; n = 5 independent experiments) (D). (E) Overexpression of mSulf2 in cells with SULF2 knockdown and in scrambled shRNA control cells. (F) Restoration of control growth with overexpression of mSulf2 in SULF2-A shRNA–containing cells (n = 3). (G) Mean tumor volume (mm3); subcutaneous flank transplant (11 days, *P < 0.05; n = 10 mice per group). (B, C, D, F, and G) Results are depicted as mean ± SEM.
Figure 3
Figure 3. Sulf2 expression in a murine model for high-grade glioma.
(A) Schema for generating high-grade, invasive glioma from adult neural progenitor cells. (BD) Invasive, high-grade tumors generated from tumorigenic neurospheres immunostained for human EGFR and H&E. Scale bars: 300 μm (B); 50 μm (C and D). Similar to human GBM, in B, the tumor invades across the corpus callosum. (E and F) Tumor cells are hEGFR positive and exhibit robust Sulf2 expression by in situ hybridization (ISH) for the Sulf2 transcript. Scale bars: 200 μm. (G) Expression of Sulf2 protein (brown) in Olig2-positive (red) tumor cells in a primary murine tumor (arrow). Scale bar: 50 μm. See also Supplemental Figures 2 and 3.
Figure 4
Figure 4. Prolonged survival conferred by ablation of Sulf2 in tumorigenic neurospheres.
(A) Similar in vitro growth of Sulf2+/+;Ink4a/Arf–/– or Sulf2–/–;Ink4a/Arf–/– tumorigenic neurospheres when cultured under nonadherent conditions (n = 3; mean ± SEM). (B) Kaplan-Meier survival analysis. Mice transplanted with Sulf2–/– cells have prolonged survival (median survival of 48 days) relative to mice transplanted with Sulf2+/+ or Sulf2+/– cells (median survival 37 days and 38 days, respectively, P < 0.001 for Sulf2–/– [n = 14] versus Sulf2+/+ [n = 9] or Sulf2+/– [n = 4]). 3 independent Sulf2–/– tumor progenitor lines were analyzed. Censored animals (black ticks) indicate individual mice sacrificed for tumor analysis prior to signs of tumor. (C) Similar tumor histology in Sulf2+/+ and Sulf2–/– tumors (H&E) despite absence of Sulf2 protein in Sulf2–/– tumor-NS (right panels, Western blot). Sulf2–/– tumors exhibit increased sulfated HSPGs (RB4CD12) compared with Sulf2+/+ tumors. Negative control antibody (MPB49) does not bind HSPG. Scale bars: 40 μm (H&E); 10 μm (HSPG, control). (D) Kaplan-Meier survival analysis demonstrating mice transplanted with tumor-NS isolated from Sulf2–/– tumors (median survival, 35 days) retain prolonged survival relative to those with tumor-NS from Sulf2+/+ tumors (median survival, 23 days). P < 0.001 for Sulf2–/– tumor-NS (n = 11) versus Sulf2+/+ tumor-NS (n = 7). See also Supplemental Figure 4.
Figure 5
Figure 5. Decreased tumor cell proliferation in the absence of Sulf2 in vivo.
(A and B) Tumor cell proliferation, as determined by immunostaining for phospho-histone H3 (a-pH3), was greater in Sulf2+/+ tumors than in Sulf2–/– tumors. Representative pH3-positive cells indicated by arrows. Scale bars: 100 μm. Insets highlight representative positive cells. (C) Quantified proliferation data; number of mean pH3-positive cells per ×200 field per mouse in Sulf2+/+ tumors was 2-fold greater than in Sulf2–/– tumors (42.9 ± 8.7 versus 19.0 ± 4.4 [± SEM] for Sulf2+/+ [n = 4] and Sulf2–/– [n = 6], respectively). *P < 0.05. (DI) In contrast, Sulf2+/+ and Sulf2–/– tumors exhibit similar expression of differentiation markers. Tumors, highlighted by hEGFR (D and G), express both GFAP (E and H) and Nestin (F and I). Scale bars: 60 μm. See also Supplemental Figure 5.
Figure 6
Figure 6. SULF2 alters activity of several RTKs in human GBM cells.
(A) RTK phosphorylation in U251 cells expressing SULF2-A shRNA or scrambled control shRNA. Individual RTKs are spotted in duplicate, and the identities of specific receptors are indicated. Positive control spots are located at the corners. See also Supplemental Figure 6. (B) Relative levels of phosphorylated RTKs in cells with knockdown of SULF2 normalized to cells with scrambled shRNA control. Duplicate spots were averaged. Data are representative of 2 independent experiments. (C) Phosphorylated and total PDGFRα levels in cells with SULF2 knockdown (S2) and scrambled shRNA control (C). Western blots were probed for GAPDH as a loading control. Results are means normalized to levels in scrambled shRNA control cells ± SEM (n = 4 independent experiments). *P < 0.01. (D) Knockdown of SULF2 decreases PDGFRα activation in response to PDGF-BB (10, 100, 200 ng/ml) stimulation. Relative levels of phosphorylated to total PDGFRα normalized to levels in unstimulated scrambled shRNA control cells. Data are representative of 2 independent experiments.
Figure 7
Figure 7. Decreased tumor cell viability conferred by knockdown of SULF2 and inhibition of PDGFR signaling.
(A) PDGFRα phosphorylation is decreased by imatinib mesylate (9 μM) in both scrambled shRNA control and SULF2-A shRNA–containing cells by Western blot. (B) Knockdown of SULF2 in combination with inhibition of PDGFRα by imatinib mesylate (9 μM) results in decreased cell viability. This effect was not observed with inhibition of EGFR signaling by AG1478 (10 μM). *P < 0.005. (C) Overexpression of mouse SULF2 (mSULF2) in control and SULF2-A shRNA–containing cells by Western blot. (D) Overexpression of mSULF2 restores PDGFRα activity in cells with knockdown of human SULF2 in an imatinib mesylate–dependent manner. All data are representative of 2 independent experiments done in quadruplicate, and data are presented as mean ± SEM. C, scrambled shRNA control; S2, SULF2-A shRNA.
Figure 8
Figure 8. Sulf2 alters the activity of PDGFRα in murine tumor-NS.
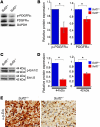
(A) Phosphorylated and total PDGFRα levels in Sulf2+/+ and Sulf2–/– tumor-NS. Western blots were probed for GAPDH as a loading control. (B) Quantification of p-PDGFRα and total PDGFRα levels in tumor-NS from Sulf2+/+ and Sulf2–/– cells normalized to mean ± SEM (n = 3 independent experiments). *P < 0.05. (C) SULF2 also affected the activity of downstream signaling pathways. Phosphorylated and total Erk1/2 (p44/p42) levels in Sulf2+/+ and Sulf2–/– tumor-NS. (D) The relative mean ratio of phosphorylated Erk to total Erk levels in Sulf2+/+ and Sulf2–/– tumor-NS normalized to Sulf2+/+ levels ± SEM (n = 3 independent experiments). *P < 0.005. (E) Sulf2+/+ tumors had more prominent phosphorylated Erk immunostaining relative to Sulf2–/– tumors. Scale bars: 50 μm.
Figure 9
Figure 9. SULF2 expression is associated with the proneural GBM subtype.
(A) SULF2 expression by human GBM subtype. Box plots show the median (range) normalized SULF2 expression levels were 8.1 (6.9–9.5), 8.9 (7.0–10.2), 7.8 (6.6–9.2), and 8.5 (7.1–9.9) for the classical, proneural, neural, and mesenchymal (mesench) subtypes, respectively (n = 173 tumors); **P < 0.005. The values within the box represent the lower quartile (Q1), median, and the upper quartile (Q3) of the distribution. The horizontal bars at the 2 ends are the smallest and largest nonoutlier observations. The circles beyond the horizontal bars represent outlying cases, defined as 1.5 times the interquartile range (Q3–Q1), below Q1 or above Q3. (B) Similarity (Pearson correlation, r) between SULF2 expression and the expression of 50 genes characterized as signature genes for each of the previously defined GBM subtypes (8). A positive coefficient denotes a positive relationship between SULF2 expression and expression of the gene of interest on the x axis (n = 202 tumors). In silico analysis for A and B was performed on expression data from the TCGA Data Portal. (C) SULF2 protein expression in primary human GBM samples of different subtypes. Tissue microarrays of previously subtyped human tumors were immunostained for SULF2 and scored. Data are represented as mean ± SEM for the classical, proneural, neural, and mesenchymal GBM subtypes, respectively (n = 28 tumors total). *P < 0.05.

Similar articles

Cited by

References

    1. Louis DN, et al. The 2007 WHO classification of tumours of the central nervous system. Acta Neuropathol. 2007;114(2):97–109. doi: 10.1007/s00401-007-0243-4. - DOI - PMC - PubMed
    1. Stommel JM, et al. Coactivation of receptor tyrosine kinases affects the response of tumor cells to targeted therapies. Science. 2007;318(5848):287–290. doi: 10.1126/science.1142946. - DOI - PubMed
    1. Brennan C, et al. Glioblastoma subclasses can be defined by activity among signal transduction pathways and associated genomic alterations. PLoS One. 2009;4(11):e7752. doi: 10.1371/journal.pone.0007752. - DOI - PMC - PubMed
    1. Kessenbrock K, Plaks V, Werb Z. Matrix metalloproteinases: regulators of the tumor microenvironment. Cell. 2010;141(1):52–67. doi: 10.1016/j.cell.2010.03.015. - DOI - PMC - PubMed
    1. Colman H, et al. A multigene predictor of outcome in glioblastoma. Neuro Oncol. 2010;12(1):49–57. doi: 10.1093/neuonc/nop007. - DOI - PMC - PubMed

Publication types

Substances