. 2012 Jan 31:9:27.
doi: 10.1186/1742-2094-9-27.

Neuroprotective function for ramified microglia in hippocampal excitotoxicity

Affiliations

Neuroprotective function for ramified microglia in hippocampal excitotoxicity

Jonathan Vinet et al. J Neuroinflammation. .

Abstract

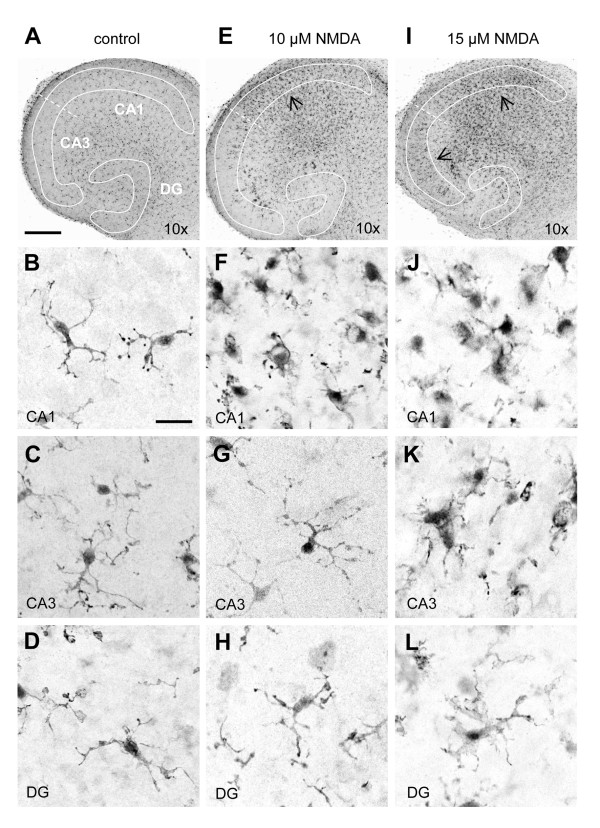
Background: Most of the known functions of microglia, including neurotoxic and neuroprotective properties, are attributed to morphologically-activated microglia. Resting, ramified microglia are suggested to primarily monitor their environment including synapses. Here, we show an active protective role of ramified microglia in excitotoxicity-induced neurodegeneration.

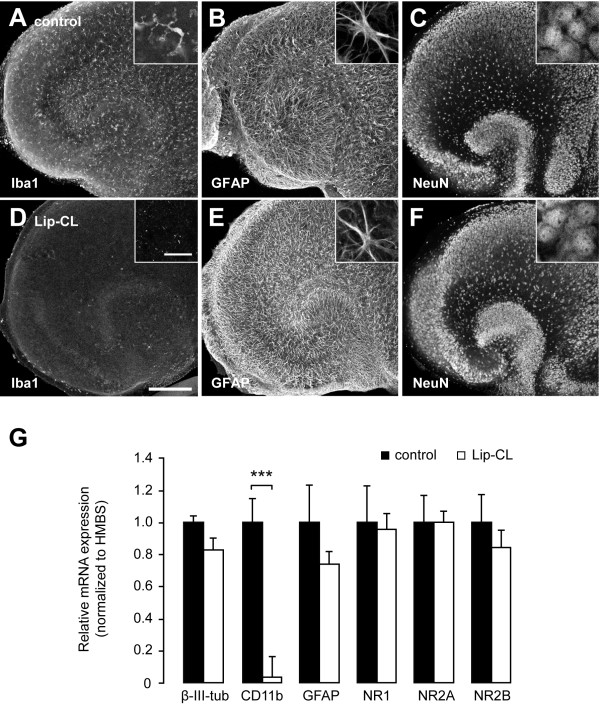
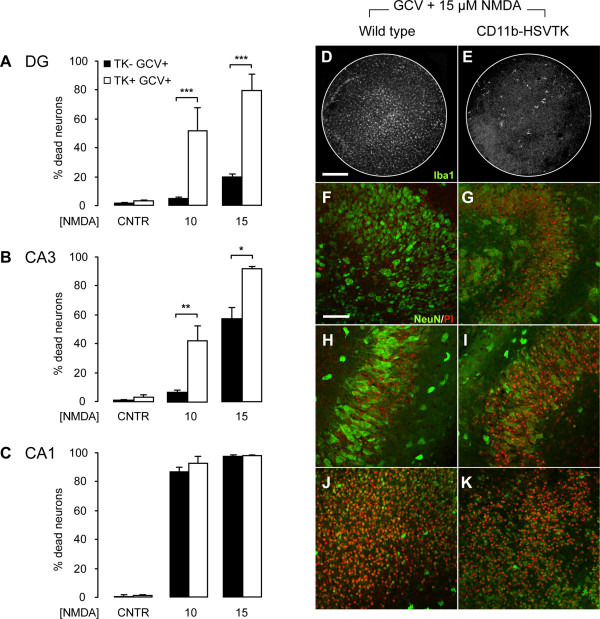
Methods: Mouse organotypic hippocampal slice cultures were treated with N-methyl-D-aspartic acid (NMDA) to induce excitotoxic neuronal cell death. This procedure was performed in slices containing resting microglia or slices that were chemically or genetically depleted of their endogenous microglia.

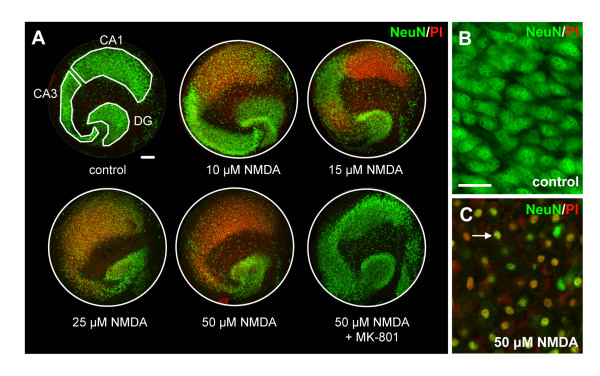
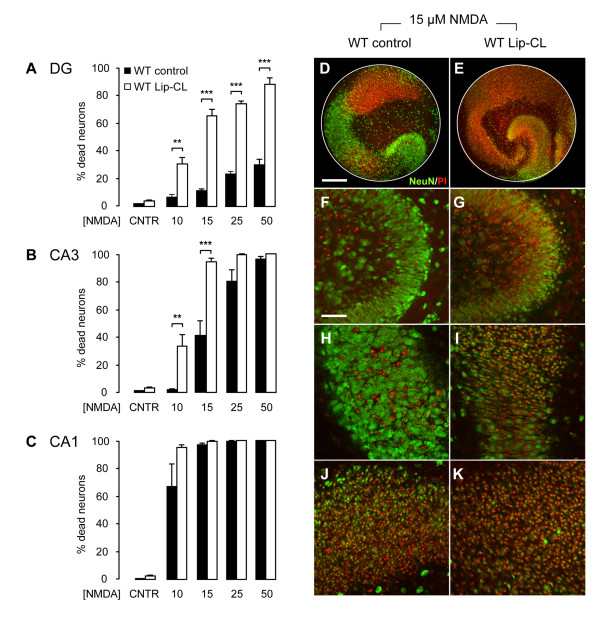
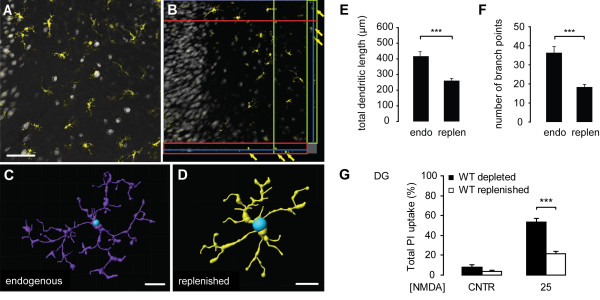
Results: Treatment of mouse organotypic hippocampal slice cultures with 10-50 μM N-methyl-D-aspartic acid (NMDA) induced region-specific excitotoxic neuronal cell death with CA1 neurons being most vulnerable, whereas CA3 and DG neurons were affected less. Ablation of ramified microglia severely enhanced NMDA-induced neuronal cell death in the CA3 and DG region rendering them almost as sensitive as CA1 neurons. Replenishment of microglia-free slices with microglia restored the original resistance of CA3 and DG neurons towards NMDA.

Conclusions: Our data strongly suggest that ramified microglia not only screen their microenvironment but additionally protect hippocampal neurons under pathological conditions. Morphological activation of ramified microglia is thus not required to influence neuronal survival.


Figures

Figure 1
Figure 1
NMDA-induced neurodegeneration in mouse hippocampal slice cultures. After 6 days in culture, hippocampal slice cultures were treated with concentrations of 0 (control), 10, 15, 25 and 50 μM NMDA. Treatment with NMDA clearly induced cell death in the slice cultures as determined by propidium iodide uptake (PI; red), which co-localized with the neuronal nuclear marker NeuN (C, white arrow), indicating that NMDA specifically induced neuronal cell death. A concentration-dependent vulnerability towards NMDA was observed as neurons of the CA1 region were most sensitive to the NMDA-treatment (with 67.1% cell death at 10 μM NMDA), followed by the CA3 (41.7% at 15 μM NMDA) and finally the DG, which showed relatively low levels of cell death even at 50 μM NMDA (30.7%). Control slice cultures showed hardly any cell death (< 1%, B). Treatment of slice cultures with the NMDA-antagonist MK-801 (30 μM) for 1 hour prior to NMDA-treatment completely blocked NMDA-induced neuronal cell death. The percentages of neuronal cell death per neuronal cell layer (DG/CA3/CA1) were quantified and are represented in figure 5. Scale bars indicate 100 μm (A) and 25 μm (B,C).
Figure 2
Figure 2
Microglial activation coincides with selective neuronal vulnerability towards excitotoxicity. Confocal images of microglia in control (A-D), 10 μM (E-H) and 15 μM (I-L) NMDA-treated slice cultures, as determined by Iba1-immuno-histochemistry. After 6 days in culture (A), microglia were evenly distributed throughout the slice cultures and displayed a typical ramified morphology (B:CA1, C:CA3, D:DG). At 10 μM NMDA (E), changes in the CA1 region were clearly visible as numerous microglia accumulated at the site of injury (E, arrow). Morphologically, these microglia displayed an "activated" phenotype (F, CA1) with enlarged somata and loss of secondary and tertiary branching. In contrast, accumulation of microglia did not occur in the CA3 (G) and DG (H) and these cells retained their ramified phenotype. At 15 μM NMDA, pronounced accumulation of morphologically activated microglia (I, arrows) was observed in both CA1 (J) and CA3 (K). In contrast, microglia in the DG (L) showed only mild activation and accumulation of microglia was minimal in this region. Scale bars indicate 300 μM (overviews) and 25 μM (magnifications). Confocal images were gray-scaled and inversed.
Figure 3
Figure 3
Liposomic clodronate specifically depletes microglia from hippocampal slice cultures. Untreated mouse hippocampal slice cultures showed preserved organotypic structure with ramified microglia (A, Iba1), astrocytes (B, GFAP) and neuronal layers CA1/CA3/DG (C, Neun). Overnight treatment with liposome-encapsulated clodronate (Lip-CL) directly after slice culture preparation resulted in specific depletion of microglia (D), while astrocytes (E) and neurons (F) remained unaffected. After 6 days in culture, the microglia population in Lip-CL treated slice cultures was reduced to less than 5% (D). Scale bars indicate 300 μM (overviews) and 25 μM (inserts). Confocal images were grey-scaled. (G) qPCR analysis of control- and Lip-CL-treated slice cultures revealed no differences in the levels of β-III-tubulin and GFAP confirming our observation that Lip-CL does not affect the presence of neurons and astrocytes. In comparison, CD11b mRNA levels were strongly reduced in Lip-CL-treated slice cultures, indicating that the number of endogenous microglia left in these slice cultures is really low. Finally, no differences were observed in NR1, NR2A and NR2B subunit mRNA levels, showing that these were not affected by the Lip-CL treatment. Bars indicate mean ± SEM. ***p < 0.001.
Figure 4
Figure 4
Depletion of microglia with Lip-CL leads to severely enhanced loss of neurons in response to excitotoxicity. Graphs represent the percentages of neuronal cell death per hippocampal region (A to C) in response to 0, 10, 15, 25 and 50 μM NMDA in untreated (WT control) and microglia-depleted slice cultures (WT Lip-CL). Microglial depletion alone did not lead to a significant increase in neuronal cell death (A-C; CNTR). However, in the absence of microglia, neuronal cell death in response to NMDA-induced excitotoxicity was severely enhanced in the DG (A) and CA3 (B). Confocal images clearly show the effect of microglial depletion on neuronal degeneration in response to 15 μM NMDA (D-K). Here, in the absence of microglia, neuronal cell death was significantly enhanced in the DG from 12.7% to 66.0% (F,G) and in the CA3 from 41.7% to 94.0% (H, I). In the CA1 (J,K) no significant effect in response to 15 μM NMDA was observed between control and Lip-CL treated slice cultures (97.1% versus 99.8%, respectively). Data are a summary of three individual experiments with at least 6 slice cultures per condition. Bars indicate mean ± SEM. **p < 0.01, ***p < 0.001, ANOVA. Scale bars indicate 300 μM (D,E) and 75 μM (F-K).
Figure 5
Figure 5
Microglial depletion in CD11b-HSVTK slice cultures by ganciclovir treatment also results in a strong increase in neuronal cell death in response to excitotoxicity. Graphs represent the percentages of neuronal cell death per hippocampal region (A to C) in response to 0, 10, and 15 μM NMDA in wild type (TK- GCV+) and microglia-depleted CD11b-HSVTK slice cultures (TK + GCV+). Microglial depletion alone did not lead to a significant increase in neuronal cell death (A-C; CNTR). However, in the absence of microglia, neuronal cell death in response to NMDA-induced excitotoxicity was severely enhanced in the DG (A) and CA3 (B). Almost no microglia cells were present when TK slices were treated with GCV (E) compared to wild type slice cultures (D). Confocal images clearly show the effect of microglial depletion on neuronal degeneration in response to 15 μM NMDA (F-K). Here, in the absence of microglia, neuronal cell death was significantly increased in the DG from 19.5% to 79.2% (F,G) and in the CA3 from 56.6% to 90.3% (H, I). In the CA1 (J,K) no significant effect in response to 15 μM NMDA was observed between wild type and TK slice cultures (96.2% versus 96.6%, respectively). Data are a summary of three individual experiments with at least 6 slice cultures per condition. Bars indicate mean ± SEM. *p < 0.05, **p < 0.01, ***p < 0.001, ANOVA. Scale bars indicate 300 μM (D,E) and 75 μM (F-K).
Figure 6
Figure 6
Replenishment of microglia-depleted slice cultures with primary mouse microglia reduces excitotoxicity-induced neuronal cell death. After 9 days in vitro, cultured primary mouse microglia were carefully pipetted onto depleted slice cultures at a density of 400 cells per slice culture. 12 days later, slice cultures were immuno-stained for NeuN (grey) and Iba1 (yellow) revealing that exogenously applied microglia showed equal distribution and a ramified morphology (A,D) and were integrated into the tissue (B). The cells (yellow arrows) had distributed themselves throughout the total depth of the slice cultures as examined by confocal microscopy (B: orthoview of a z-stack). 3D reconstructions of microglia filaments, created by IMARIS filament tracer software from Iba1 fluorescently stained cells in z-stacks of slice cultures, were used to analyse the morphology of endogenous microglia and replenished primary mouse microglia. Figure C and D show examples for reconstructions of endogenous microglia (endo microglia) and replenished primary microglia (primary microglia), respectively. The starting point of the filaments was set at the cell soma (blue). Analysis of the morphologic parameters total dendritic length (E) and number of branch points (F) revealed significantly shorter dendritic length and less branching points in replenished primary microglia compared to endogenous microglia (*** p < 0.001). NMDA (25 μM)-induced neuronal cell death in the dentate gyrus was significantly reduced in slice cultures replenished with primary mouse microglia (21.6%) compared to microglia-free slice cultures (53.6%), as determined by total PI uptake (G). Data are provided as mean ± SEM. N = 25 cells per group for E and F and N = 4 for G. Scale bars: Scale bars indicate 100 μm (A-B; shown in A) and 10 μm (C-D).

References

    1. Bechmann I, Galea I, Perry VH. What is the blood-brain barrier (not)? Trends Immunol. 2007;28:5–11. doi: 10.1016/j.it.2006.11.007. - DOI - PubMed
    1. Kreutzberg GW. Microglia: a sensor for pathological events in the CNS. Trends Neurosci. 1996;19:312–318. doi: 10.1016/0166-2236(96)10049-7. - DOI - PubMed
    1. Van Rossum D, Hanisch UK. Microglia. Metab Brain Dis. 2004;19:393–411. - PubMed
    1. Hanisch UK, Kettenmann H. Microglia: active sensor and versatile effector cells in the normal and pathologic brain. Nat Neurosci. 2007;10:1387–1394. doi: 10.1038/nn1997. - DOI - PubMed
    1. Streit WJ. Microglia as neuroprotective, immunocompetent cells of the CNS. Glia. 2002;40:133–139. doi: 10.1002/glia.10154. - DOI - PubMed

Publication types

MeSH terms

LinkOut - more resources