. 2012 Mar 7;31(5):1160-76.
doi: 10.1038/emboj.2011.490. Epub 2012 Jan 31.

APRIN is a cell cycle specific BRCA2-interacting protein required for genome integrity and a predictor of outcome after chemotherapy in breast cancer

Affiliations

APRIN is a cell cycle specific BRCA2-interacting protein required for genome integrity and a predictor of outcome after chemotherapy in breast cancer

Rachel Brough et al. EMBO J. .

Abstract

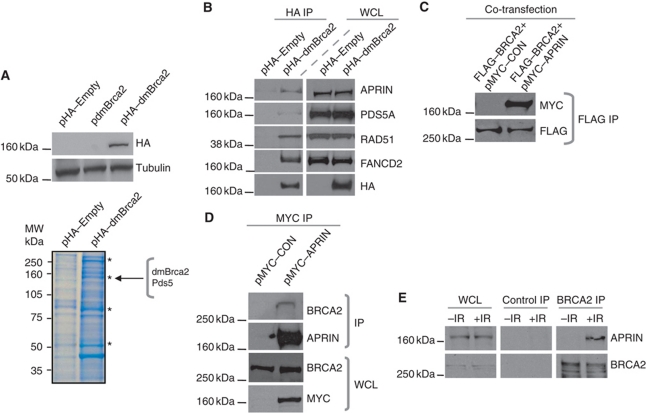
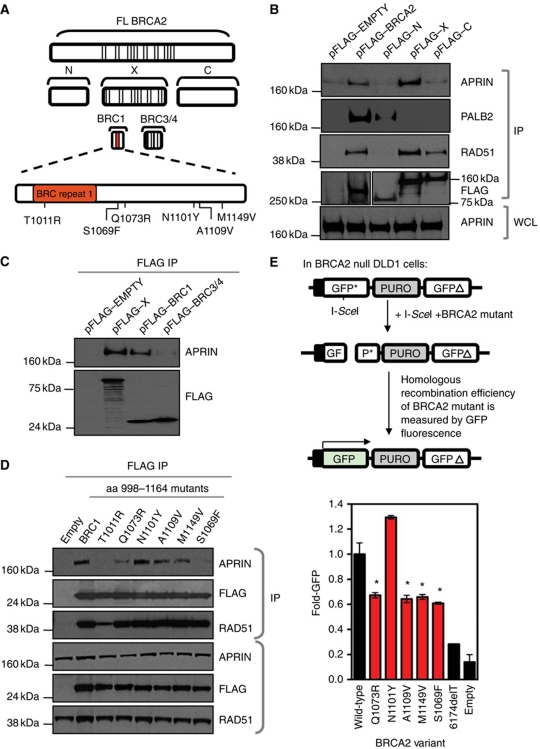
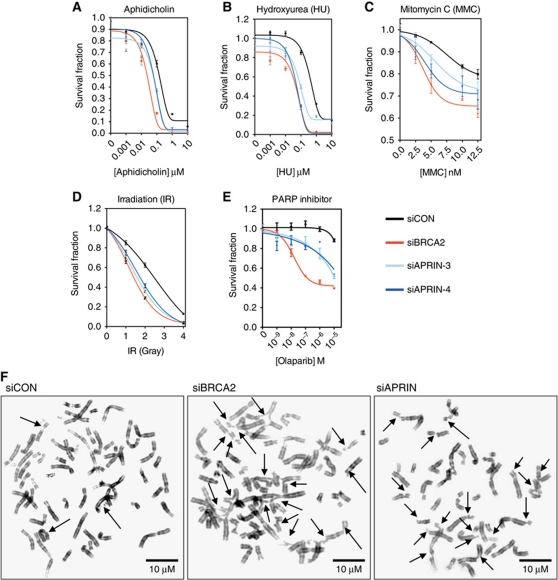
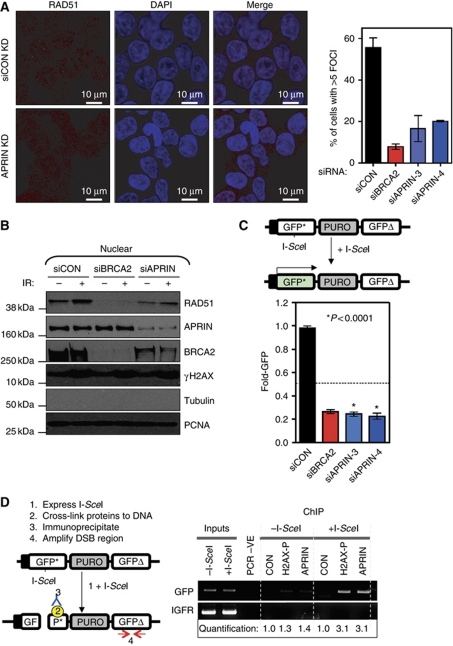
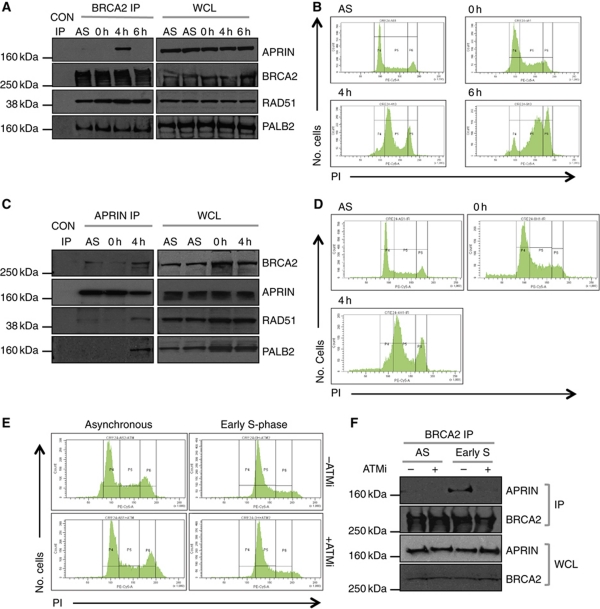
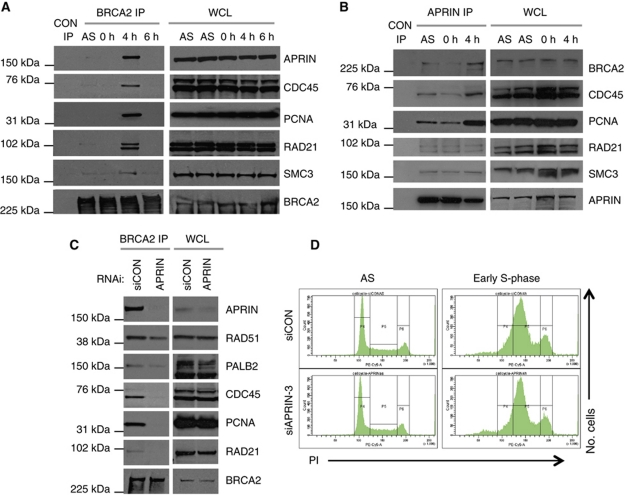
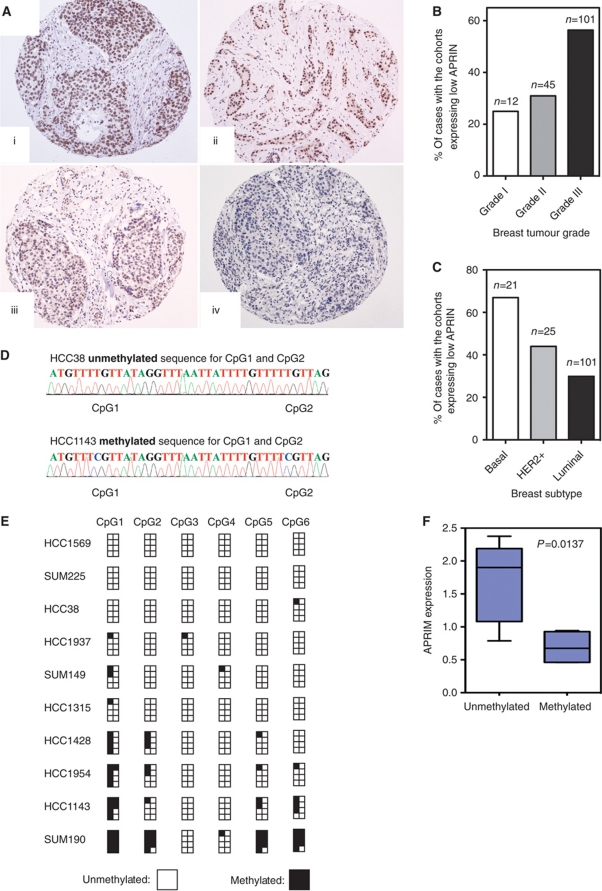
Mutations in BRCA2 confer an increased risk of cancer development, at least in part because the BRCA2 protein is required for the maintenance of genomic integrity. Here, we use proteomic profiling to identify APRIN (PDS5B), a cohesion-associated protein, as a BRCA2-associated protein. After exposure of cells to hydroxyurea or aphidicolin, APRIN and other cohesin components associate with BRCA2 in early S-phase. We demonstrate that APRIN expression is required for the normal response to DNA-damaging agents, the nuclear localisation of RAD51 and BRCA2 and efficient homologous recombination. The clinical significance of these findings is indicated by the observation that the BRCA2/APRIN interaction is compromised by BRCA2 missense variants of previously unknown significance and that APRIN expression levels are associated with histological grade in breast cancer and the outcome of breast cancer patients treated with DNA-damaging chemotherapy.


Conflict of interest statement

AA and CJL are inventors named on patents describing the use of PARP inhibitors and may benefit under the ICR ‘Rewards to Investors’ Scheme.

Figures

Figure 1
Figure 1
BRCA2 interacts with APRIN. (A) (Top panel) Western blot analysis of whole cell lysates (WCL) from Drosophila Kc cells transfected with pHA–Empty, pdmBrca2 or pHA–dmBrca2 expression constructs. Immunoblots were probed with an HA-epitope tag-specific antibody or a β-tubulin antibody as shown, indicating expression of the HA–dmBrca2 fusion protein. (Bottom panel) Coomassie-stained polyacrylamide gel containing anti-HA immunoprecipitated material from Drosophila Kc cells transfected with either pHA–Empty or pHA–dmBrca2 expression constructs. Position of dmBrca2 and Pds5-containing bands removed for Q-TOF mass spectrometry analysis are shown. Asterisks indicate additional bands excised for mass spectrometry analysis. MW, molecular weight. (B) Western blot analysis of anti-HA immunoprecipitates or WCL from human 293T cells transiently expressing either pHA–Empty or pHA–dmBrca2 constructs. Blots were probed with anti-human APRIN, PDS5A, RAD51, FANCD2 and HA antibodies as shown. (C) Western blot analysis of anti-FLAG immunoprecipitates from human 293T cells transiently expressing FLAG-epitope-tagged human BRCA2 as well as MYC-epitope-tagged human APRIN or a control (CON) construct. Blots were probed with anti-FLAG or anti-MYC antibodies as shown, suggesting a human BRCA2/APRIN interaction. (D) Western blot analysis of anti-MYC immunoprecipitates or WCL from human 293T cells transiently expressing MYC-epitope-tagged APRIN or a control (CON) construct. Blots were probed with anti-human BRCA2, anti-human APRIN or anti-MYC antibodies as shown, suggesting a human BRCA2/APRIN interaction. (E) Western blot analysis of anti-human BRCA2 immunoprecipitates or WCL from untransfected human 293T cells exposed to 10 Gy of IR. Lysates were collected 2 h following treatment and blots were probed with anti-human BRCA2 or anti-human APRIN antibodies as shown, suggesting an endogenous human BRCA2/APRIN interaction following damage. Figure source data can be found in Supplementary data.
Figure 2
Figure 2
APRIN interacts with the BRCA2 BRC1 repeat. (A) Schematic diagram of FLAG-tagged fragments of human BRCA2 used in the experiments described in (BE). FL BRCA2=aa 1–3418; fragment N=aa 1–627; fragment X=aa 786–1909; fragment C=aa 2126–3418; fragment BRC1=aa 998–1164; fragment BRC3/4=aa 1386–1560. In addition, the position of six missense mutations within the BRC1 BRCA2 fragment (aa 998–1164) that were investigated in (D, E) are shown. Not to scale. (B) Western blot analysis of whole cell lysates (WCL) and anti-FLAG immunoprecipitates from 293T cells transiently expressing BRCA2 fragments from pFLAG–EMPTY, pFLAG–BRCA2 (FL), pFLAG–N, pFLAG–X and pFLAG–C constructs. Blots were probed with anti-APRIN and the control antibodies anti-PALB2, anti-RAD51 and anti-FLAG, as shown. This demonstrates an interaction between APRIN and fragment X of BRCA2 (aa 786–1909), as well as FL BRCA2. Confirmation of this association was also seen using a mammalian two-hybrid method (Supplementary Figure S2A). Validation of appropriate fragment behaviour was controlled by detection of PALB2 binding to the N fragment of BRCA2 only and RAD51 binding to both the X- and C-terminus. (C) Western blot analysis of anti-FLAG immunoprecipitates from 293T cells transiently expressing pFLAG–EMPTY, pFLAG–X, pFLAG–BRC1 or pFLAG–BRC3/4. Blots were probed with anti-APRIN or anti-FLAG antibodies as shown, demonstrating an interaction between APRIN and the BRC1 fragment of BRCA2 (aa 998–1164). (D) Western blot analysis of anti-FLAG immunoprecipitates and WCL from 293T cells transiently expressing six of the FLAG-tagged mutated fragments of BRCA2 (aa 998–1164) assessed in Supplementary Figure S2B and illustrated in (A). Blots were probed with anti-APRIN, anti-FLAG or anti-RAD51 antibodies as shown. A number of BRCA2 variants abrogate the BRCA2/APRIN interaction. (E) BRCA2 species containing the indicated missense variants were expressed in BRCA2−/− DLD1 cells along with DR-GFP and ISCE1 reporter constructs. After 48 h, GFP-positive cells were quantified by flow cytometry. Error bars represent standard errors of the mean. *P<0.05 (Student's t test) compared to wild type.
Figure 3
Figure 3
APRIN silencing increases genomic instability and heightens sensitivity to DNA-damaging agents. (AC) Survival curves of 293T cells transfected with siRNA targeting APRIN and then treated with either (A) aphidicholin or (B) HU or (C) MMC for 5 days. (D, E) Survival curves generated from colony formation assays on adherent Hela cells transfected with siRNA targeting APRIN then exposed to either (D) IR or (E) PARP inhibitor. For (AE), two different siRNA species (siAPRIN-3 and siAPRIN-4) were used in separate experiments. Non-targeting control siRNA (siCON) and siRNA targeting BRCA2 were used as negative and positive controls, respectively. Error bars represent standard errors of the mean from three replicate experiments. (F) Metaphase chromosome images generated from 293T cells treated with control, BRCA2 or APRIN siRNA after MMC exposure. The prevalence of specific chromosomal aberrations between the different siRNA treatments was compared using a two-tailed heteroscedastic t-test (n=50) and are summarised in Table I. Scale bar represents 10 μM.
Figure 4
Figure 4
APRIN is involved in DNA repair. (A) (Left panel) Representative confocal microscopy images from 293T cells transfected with non-targeting control siRNA or siRNA targeting APRIN. Forty-eight hours after transfection, cells were exposed to 10 Gy IR and then fixed and stained using a nuclear dye (DAPI, blue in image) and an anti-RAD51 antibody. Nuclear IR-induced RAD51 foci are shown in red. The scale bar represents 10 μM. (Right panel) Graphical representation of this data is shown. Cells were treated with control (siCON), BRCA2 or APRIN siRNA (siBRCA2 and siAPRIN, respectively), as shown. The proportion of cells containing five or more nuclear RAD51 foci after IR was estimated from three independent experiments (n>100 for each experiment). Error bars for each individual experiment represent standard errors of the mean. (B) Western blot analysis of nuclear proteins from 293T cells treated as in (A). Cells were transfected and irradiated as in (A). Following cytosolic/nuclear extraction, the nuclear fraction was analysed by western blot using antibodies detecting RAD51, APRIN, BRCA2, γH2AX, β-tubulin and PCNA. PCNA (nuclear specific) and β-tubulin (cytosolic) expression confirmed successful fractionation. See Supplementary Figure S3D for analysis of the cytosolic fraction. (C) (Top panel) Schematic of the pDR-GFP HR assay. The DR-GFP recombination substrate encompasses (from left to right); an hCMV enhancer/chicken β-actin promoter (black box); a modified GFP* (a GFP gene containing an integrated I-SceI endonuclease restriction site that leads to a premature stop codon); a puromycin drug selectable marker (PURO); and a second modified GFP-coding sequence (GFPΔ), which harbours 5′ and 3′ truncations. Neither GFP* nor GFPΔ are functional GFP ORFs. Expression of I-SceI in cells carrying a DR-GFP reporter induces a DSB in GFP*. Repair of this DSB by HR/gene conversion uses the GFPΔ gene as a template, and results in the removal of the termination codons from GFP*, reconstitution of a functional GFP ORF and GFP-mediated fluorescence. Non-conservative forms of repair do not reconstitute the GFP ORF and do not lead to GFP expression. (Bottom panel) Twenty-four hours following transfection with the indicated siRNA, Hela cells harbouring a single-copy genomic integration of the DR-GFP reporter, with or without I-SceI. GFP expression was estimated by FACS analysis and is represented in the graph. Error bars represent standard errors of the mean from three separate experiments. (D) (Left panel) Schematic of the ChIP–PCR assay used, which is based upon the HR reporter construct described in (C). 293T cells harbouring a genomic HR reporter were transfected with an I-SceI expression construct that caused a DSB within the GFP* gene. Twenty-four hours after transfection, chromatin-bound proteins were cross-linked to DNA and cells lysed. After sonication of the genomic DNA, IP was performed using an anti-APRIN antibody. To ascertain the presence of DNA flanking, the DSB site in immunoprecipitates, PCR amplifying a GFP sequence was used. Positive control (anti-γH2AX) and negative control (anti-FLAG) IPs were used to validate the assay. A region of the IGFR gene was also amplified to demonstrate specificity of γH2AX and APRIN to DSB regions rather than genomic DNA as a whole. (Right panel) 293T cells harbouring the pDR-GFP reporter construct were transfected with the I-SceI expression construct and 24 h later, ChIP–PCR was performed as described above. In the PCR-negative control, DNA was substituted with water in the PCR reaction. This analysis indicated that after transfection of the I-SceI expression construct, the amount of DSB-flanking DNA that co-immunoprecipitated with γH2AX was elevated, compared with levels in cells not expressing I-SceI, thus validating the assay. In addition, the amount of DSB-flanking DNA that co-immunoprecipitated with APRIN when cells were transfected with the I-SceI expression construct was also elevated, suggesting that APRIN is present at or near the site of DSBs. Quantification of the PCR bands are shown, normalised to the control ChIP without I-SceI treatment.
Figure 5
Figure 5
The BRCA2/APRIN interaction is cell-cycle dependent. (A) Western blot analysis of BRCA2 immunoprecipitated material or whole cell lysates (WCL) from AS or synchronous 293T cultures. For synchronous cultures, cells were arrested at the G1/S checkpoint by aphidicolin treatment (18 h) and then released into the cell cycle by the removal of aphidicolin (t=0 h). Samples were taken for IP at 0, 4 and 6 h after release as shown. Western blots were probed with antibodies detecting human endogenous APRIN, BRCA2, RAD51 or PALB2 as shown. (B) PI cell-cycle FACS profiles of cells treated in (A). (C) Western blot analysis of APRIN immunoprecipitated material or WCL from AS 293T cultures or 293T cells treated with aphidicolin as in (A). Samples were taken for IP at 0 and 4 h after release as shown. Western blots were probed with antibodies detecting human endogenous BRCA2, APRIN, RAD51 or PALB2 as shown. (D) PI cell-cycle FACS profiles of cells treated in (C). (E) PI cell-cycle FACS profiles of 293T cells treated with the ATM catalytic inhibitor KU0055933. Samples were collected for analysis in early S-phase. Cell-cycle arrest and synchronisation was achieved using the aphidicolin method (see (A)). (F) Western blot analysis of BRCA2 immunoprecipitates and WCL from cells in (E). Blots were probed with anti-APRIN or BRCA2 antibodies as shown, suggesting that the APRIN/BRCA2 interaction is abrogated by inhibition of ATM.
Figure 6
Figure 6
BRCA2 and APRIN associate with cohesion proteins and replication complex. (A) Western blot analysis of BRCA2 immunoprecipitated material or whole cell lysates (WCL) from AS or synchronous 293T cultures. For synchronous cultures, cells were arrested at the G1/S checkpoint by aphidicolin treatment (18 h) and then released into the cell cycle by the removal of aphidicolin (t=0 h). Samples were taken for IP at 0, 4 and 6 h after release as shown. Western blots were probed with antibodies detecting human endogenous APRIN, CDC45, PCNA, RAD21, SMC3 and BRCA2 as shown. (B) Western blot analysis of APRIN immunoprecipitated material or WCL from AS or synchronous 293T cultures as in (A). Samples were taken for IP at 0 and 4 h after release as shown. Western blots were probed with antibodies detecting human endogenous BRCA2, CDC45, PCNA, RAD21, SMC3 and APRIN as shown. (C) Western blot analysis of BRCA2 immunoprecipitated material or WCL from synchronised, early S-phase 293T cultures as in (A). Cells were transfected with siRNA as shown, 48 h prior to aphidicolin treatment and samples taken for analysis at 4 h after release from aphidicolin treatment. Western blots were probed with antibodies as shown. See also Supplementary Table SI. (D) PI FACS profiles of 293T cells treated with siRNA silencing APRIN. Cells were transfected with siRNA 48 h prior to aphidicolin treatment. FACS analysis was performed 4 h after release from aphidicolin treatment. Figure source data can be found in Supplementary data.
Figure 7
Figure 7
APRIN expression correlates with response to chemotherapy. (A) Representative micrographs of APRIN expression in invasive breast cancers; (i, ii) illustrate normal levels of APRIN expression with (i) generating a score of 9 and (ii) a score of 8; (iii, iv) show reduced levels of APRIN expression with (iii) generating a score of 6 and (iv) a score of 2. (i–iv) (haematoxylin/DAB × 100). For distribution of scores see Supplementary Figure S5A. (B) Correlation between high grade (grade III) and low APRIN expression (two-tailed t-test: P<0.005). (C) Low APRIN expression also correlates with basal breast cancer phenotype (two-tailed t-test: P<0.05). (D) The chromatograms illustrate the sequence of unmethylated CpG1 and CpG2 seen in all HCC38 clones (top) and the methylated sequence of CpG1 and CpG2 seen in most HCC1143 clones (bottom). (E) A graphical representation of the proportion of methylated CpGs detected for each of the 10 basal cell lines. (F) A box and whisker diagram illustrating that detectable APRIN mRNA levels are significantly lower in the APRIN methylated lines, when compared with unmethylated lines (P=0.0137, Student's t-test) as assessed by RT–PCR.

References

    1. Ammazzalorso F, Pirzio LM, Bignami M, Franchitto A, Pichierri P (2010) ATR and ATM differently regulate WRN to prevent DSBs at stalled replication forks and promote replication fork recovery. EMBO J 29: 3156–3169 - PMC - PubMed
    1. Arriola E, Rodriguez-Pinilla SM, Lambros MB, Jones RL, James M, Savage K, Smith IE, Dowsett M, Reis-Filho JS (2007) Topoisomerase II alpha amplification may predict benefit from adjuvant anthracyclines in HER2 positive early breast cancer. Breast Cancer Res Treat 106: 181–189 - PubMed
    1. Bakkenist CJ, Kastan MB (2004) Phosphatases join kinases in DNA-damage response pathways. Trends Cell Biol 14: 339–341 - PubMed
    1. Beckmann MW, Picard F, An HX, van Roeyen CR, Dominik SI, Mosny DS, Schnurch HG, Bender HG, Niederacher D (1996) Clinical impact of detection of loss of heterozygosity of BRCA1 and BRCA2 markers in sporadic breast cancer. Br J Cancer 73: 1220–1226 - PMC - PubMed
    1. Bonner WM, Redon CE, Dickey JS, Nakamura AJ, Sedelnikova OA, Solier S, Pommier Y (2008) GammaH2AX and cancer. Nat Rev Cancer 8: 957–967 - PMC - PubMed

Publication types

MeSH terms