

Cancer mortality-to-incidence ratios in Georgia: describing racial cancer disparities and potential geographic determinants
- PMID: 22294294
- PMCID: PMC3342438
- DOI: 10.1002/cncr.26728
Cancer mortality-to-incidence ratios in Georgia: describing racial cancer disparities and potential geographic determinants
Abstract
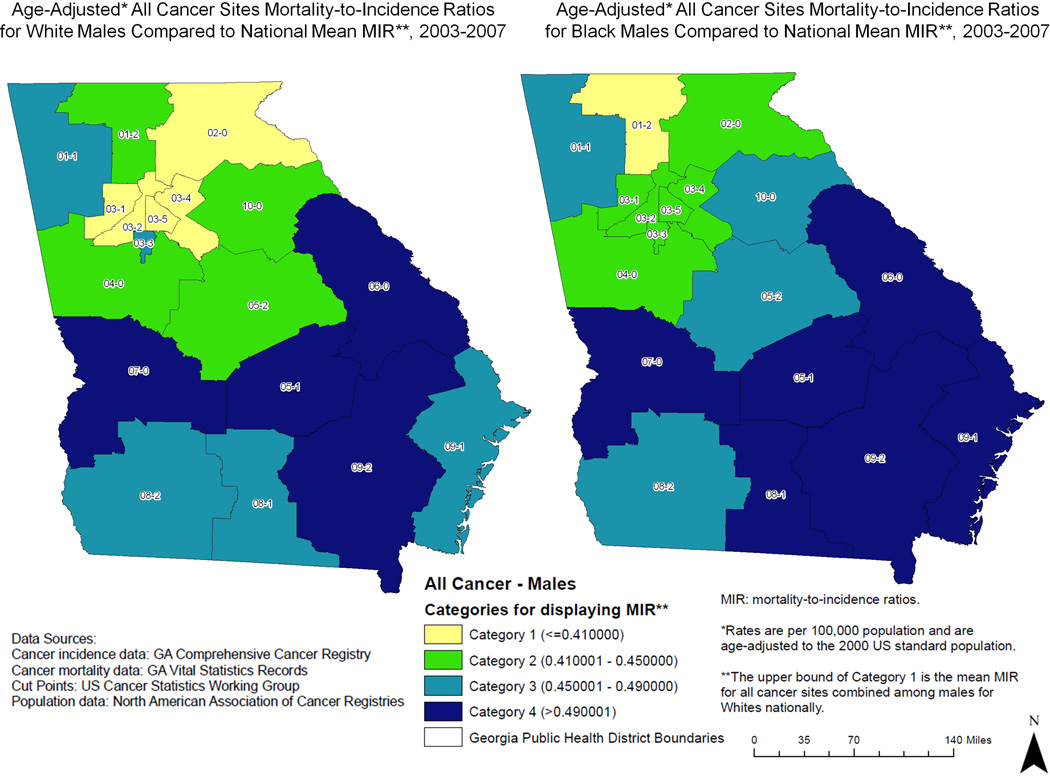
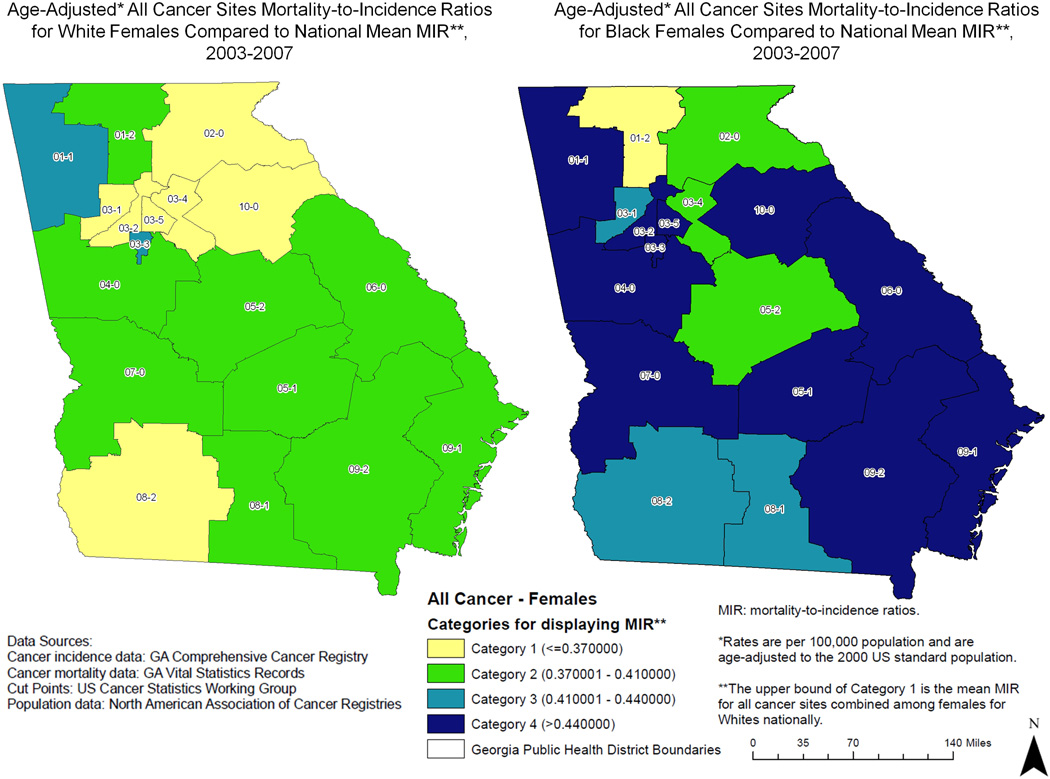
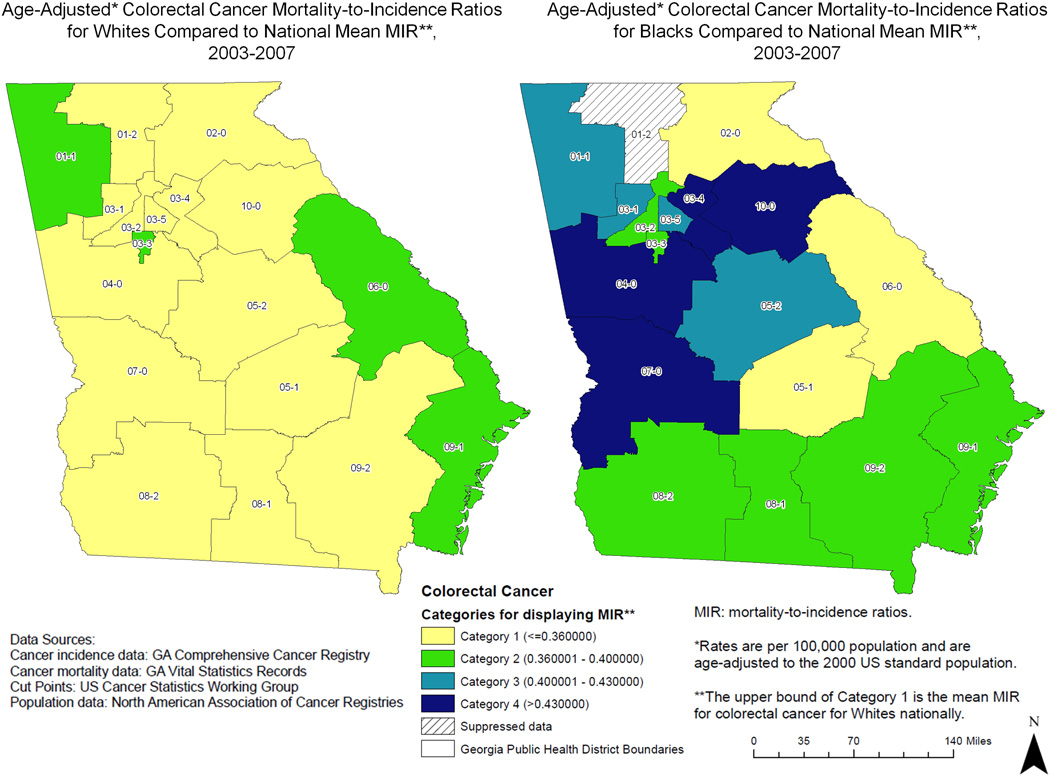
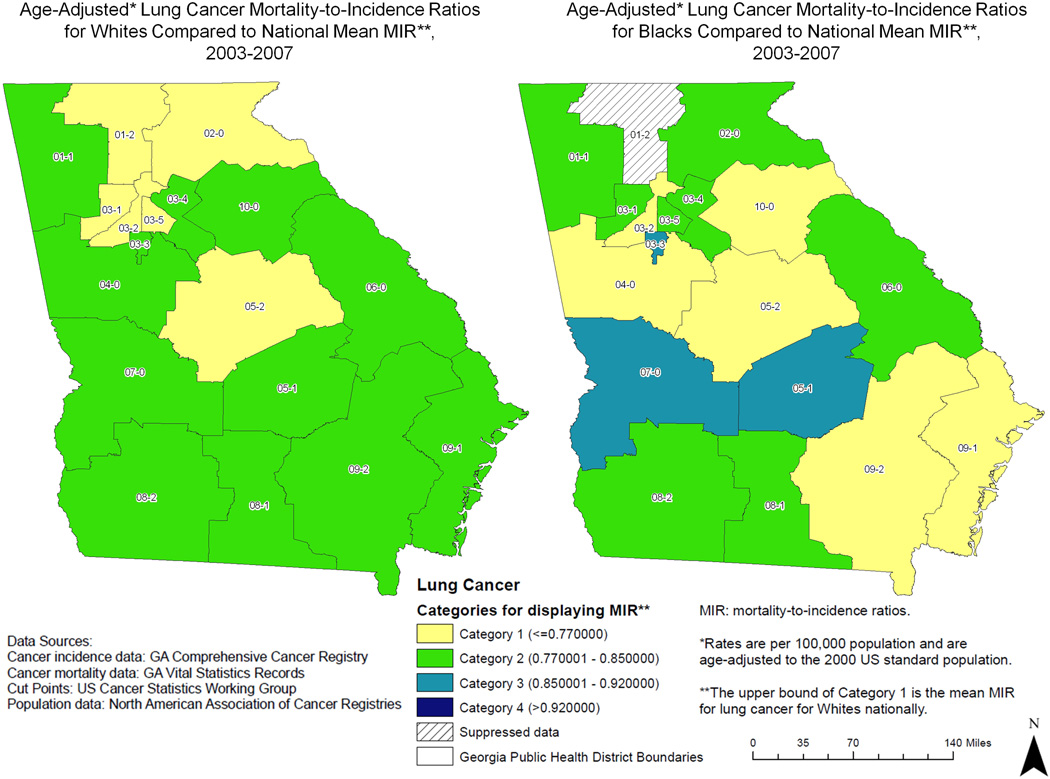
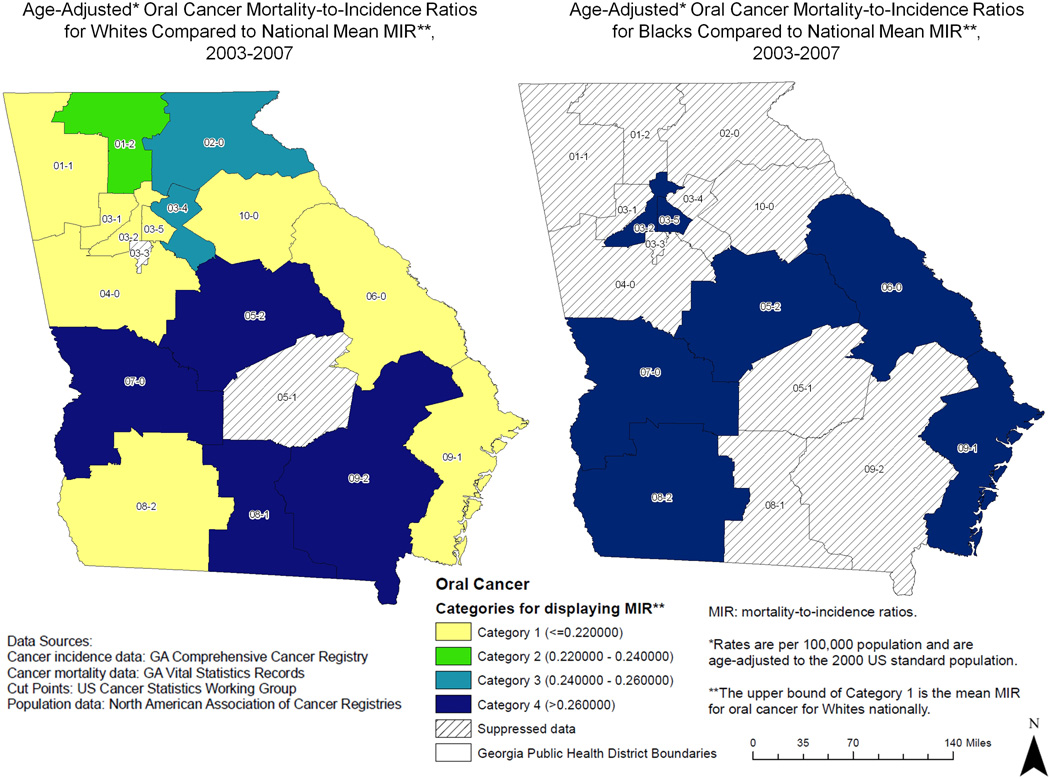
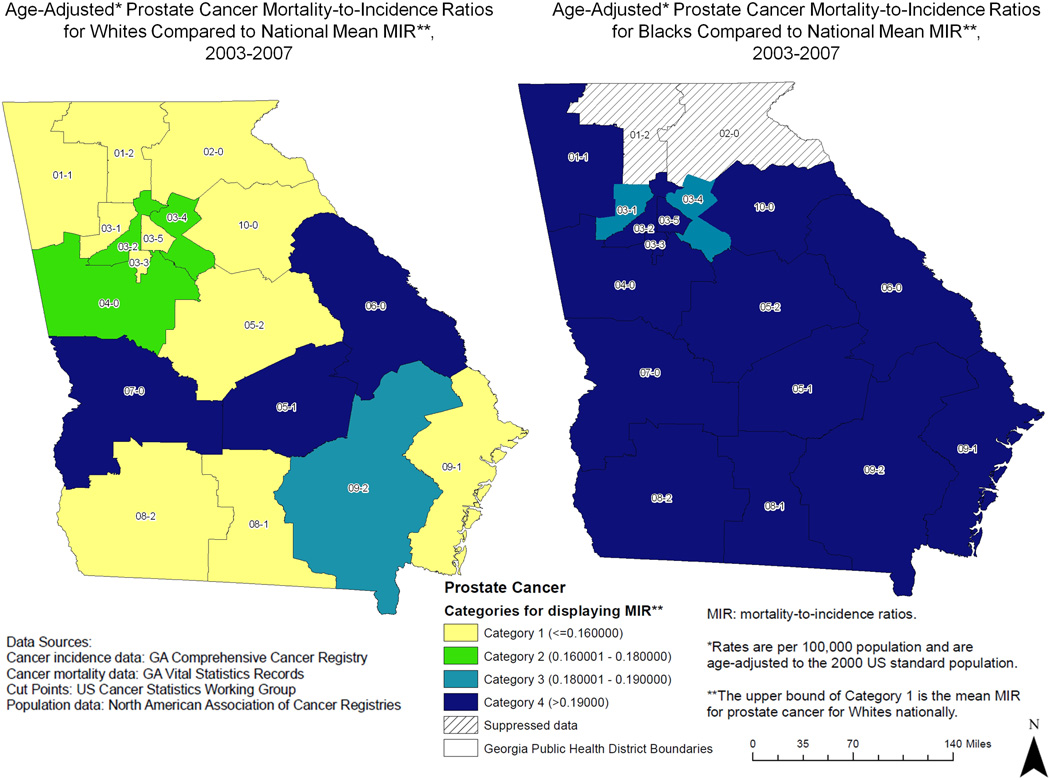
Background: The objective of this study was to evaluate racial cancer disparities in Georgia by calculating and comparing mortality-to-incidence ratios (MIRs) by health district and in relation to geographic factors.
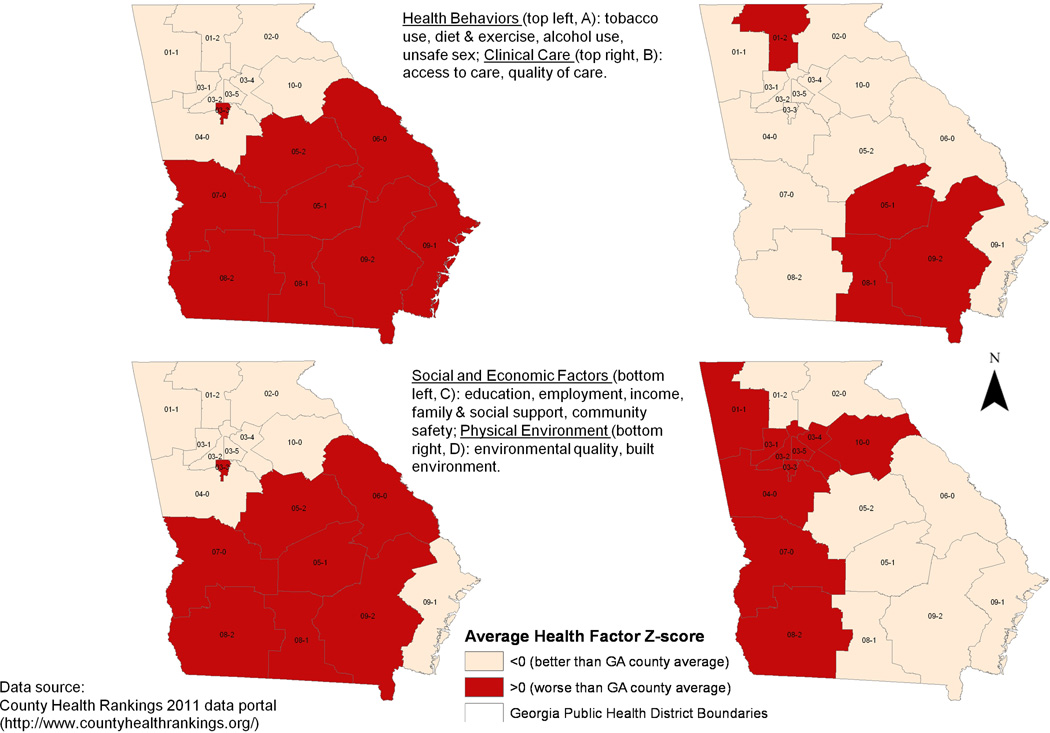
Methods: Data sources included cancer incidence (Georgia Comprehensive Cancer Registry), cancer mortality (Georgia Vital Records), and health factor (County Health Rankings) data. Age-adjusted incidence and mortality rates were calculated by cancer site (all sites combined, lung, colorectal, prostate, breast, oral, and cervical) for 2003-2007. MIRs and 95% confidence intervals were calculated overall and by district for each cancer site, race, and sex. MIRs were mapped by district and compared with geographic health factors.
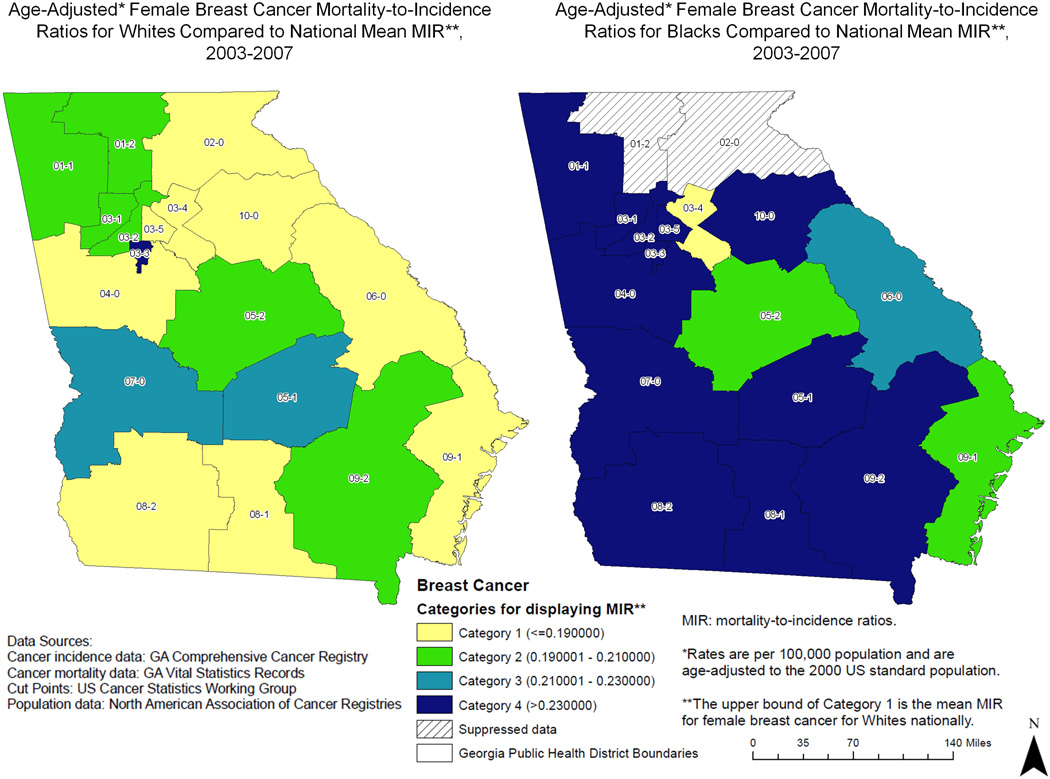
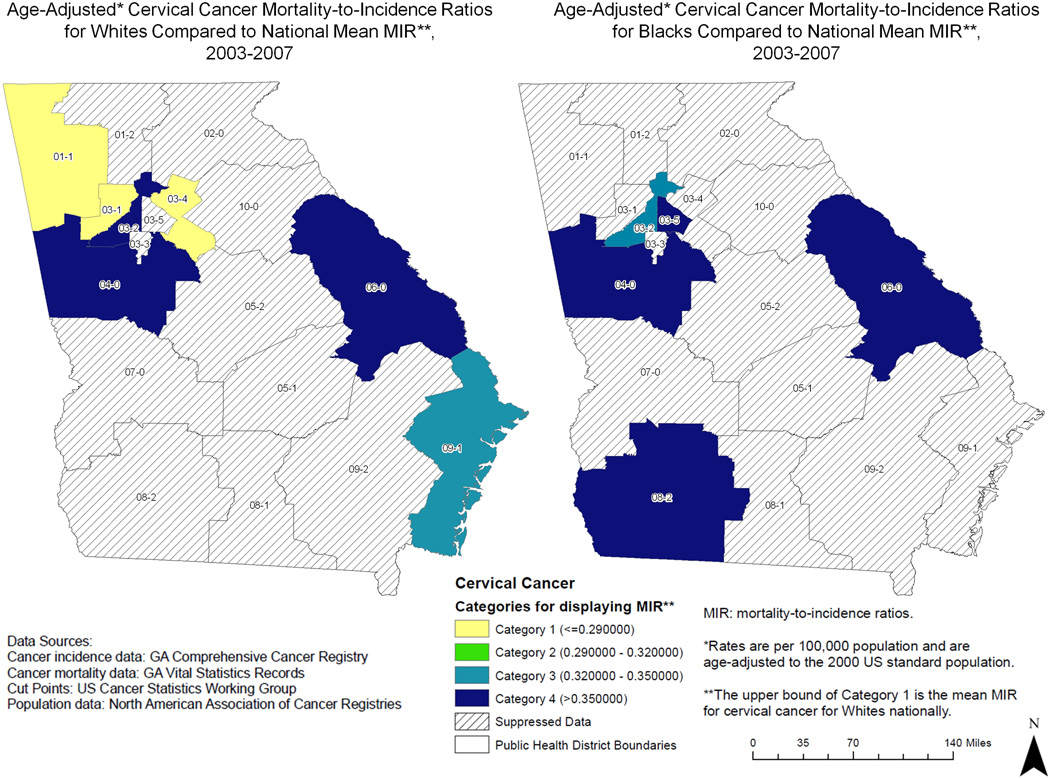
Results: In total, 186,419 incident cases and 71,533 deaths were identified. Blacks had higher MIRs than whites for every cancer site evaluated, and especially large differentials were observed for prostate, cervical, and oral cancer in men. Large geographic disparities were detected, with larger MIRs, chiefly among blacks, in Georgia compared with national data. The highest MIRs were detected in west and east central Georgia, and the lowest MIRs were detected in and around Atlanta. Districts with better health behavior, clinical care, and social/economic factors had lower MIRs, especially among whites.
Conclusions: More fatal cancers, particularly prostate, cervical, and oral cancer in men were detected among blacks, especially in central Georgia, where health behavior and social/economic factors were worse. MIRs are an efficient indicator of survival and provide insight into racial cancer disparities. Additional examination of geographic determinants of cancer fatality in Georgia as indicated by MIRs is warranted.
Copyright © 2012 American Cancer Society.
Figures
References
-
- Ward E, Jemal A, Cokkinides V, Singh GK, Cardinez C, Ghafoor A, et al. Cancer disparities by race/ethnicity and socioeconomic status. CA Cancer J Clin. 2004;54(2):78–93. Available from http://www.ncbi.nlm.nih.gov/entrez/query.fcgi?cmd=Retrieve&db=PubMed&dop.... - PubMed
-
- [NCI] [Accessed July 19 2011];National Cancer Institute, Cancer health disparities. http://www.cancer.gov/cancertopics/factsheet/disparities/cancer-health-d....
-
- Singh S, Bayakly AR, McNamara C, Redding K, Thompson SK, Wall K Georgia Cancer Data Report, 2005. Southeast Division. 2006. Georgia Department of Human Resources, Divisions of Public Health, Chronic Disease, Injury, and Envrionmental Epidemiology Section, and the American Cancer Society. Publication Number: DPH06/007HW.
Publication types
MeSH terms
Grants and funding
LinkOut - more resources
Full Text Sources
Medical
